Proveedor oficial
Como distribuidores oficiales y autorizados, le suministramos licencias legítimas directamente de más de 200 editores de software.
Ver todas nuestras marcas.

Notas de la versión: objects for your report templates such as gauges, data graphics, checkboxes and PDF files. Charts: Create ... pie charts intuitively with just a few clicks. Further chart types will be added successively. ... elements such as letterheads, tables and charts as subreports or includes. New export format options: Word: ... Leer más Mostrar más resultados de este producto
Capturas de pantalla: 0 ... Leer más
Notas de la versión: Feature: Bar Charts are now supported. Web Report Viewer: The setter ... now serves as compatibility switch. Defaults to “False”. Email If for a graph connection ... (converting them to a preview file when passed). Charts: When trying to calculate the positions of coordinate ... Leer más

Notas de la versión: objects for your report templates such as gauges, data graphics, checkboxes and PDF files. Charts: Create ... pie charts intuitively with just a few clicks. Further chart types will be added successively. ... elements such as letterheads, tables and charts as subreports or includes. New export format options: Word: ... Leer más Mostrar más resultados de este producto
Capturas de pantalla: 0 ... Leer más
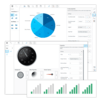
Funciones: The List & Label reporting tool offers a wealth of chart types: pie charts, cone, donut ... and line charts, octahedrons and multi-rows, Gantt charts, shapefile, area and bubble charts, plus gauges ... Leer más

Notas de la versión: data graphics, checkboxes and PDF files. Charts: Create pie charts intuitively with just a few clicks. ... Further chart types will be added successively. Repository: Add structure and clarity to the content ... recurring elements such as letterheads, tables and charts as subreports or includes. New export format ... Leer más Mostrar más resultados de este producto
Capturas de pantalla: 0 ... Leer más
Funciones: The List & Label reporting tool offers a wealth of chart types: pie charts, cone, donut ... and line charts, octahedrons and multi-rows, Gantt charts, shapefile, area and bubble charts, plus gauges ... Leer más