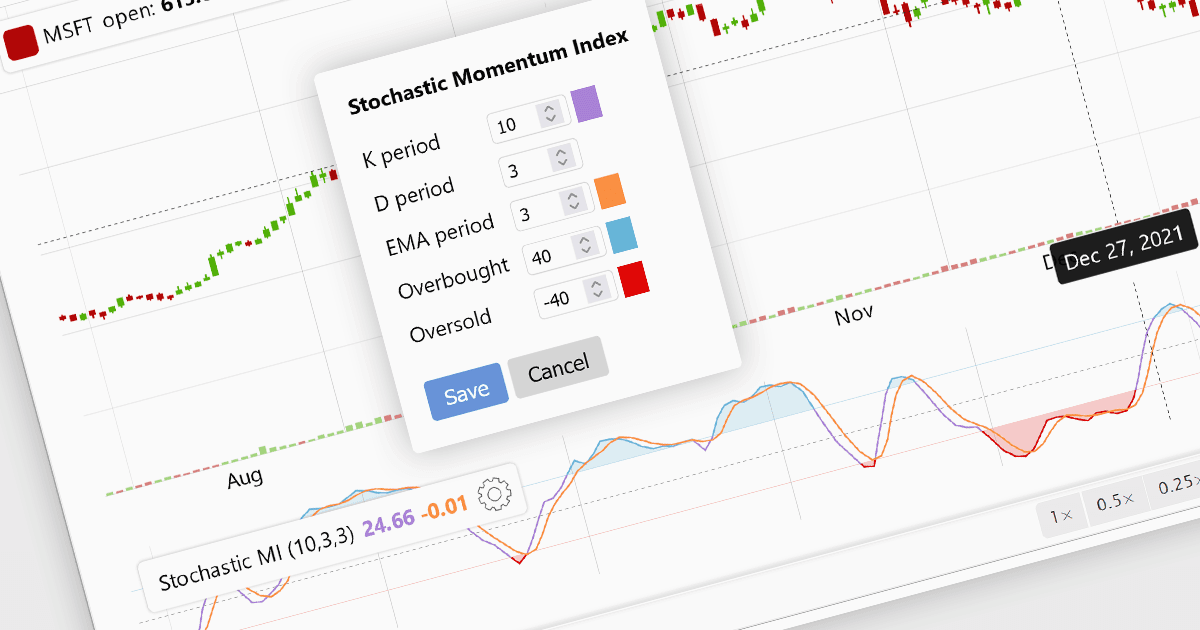
Enhance Stock Analysis with the SMI Indicator
amCharts 5: Stock Chart v5.5.3 adds support for the Stochastic Momentum Index indicator, helping users make more informed trading decisions.
Visualize and analyze time-based financial data efficiently.
Prices from:
| Available individually | Our Price |
|---|---|
| amCharts 5: Stock Chart | Loading |
Trial version available Contact us for a free trial
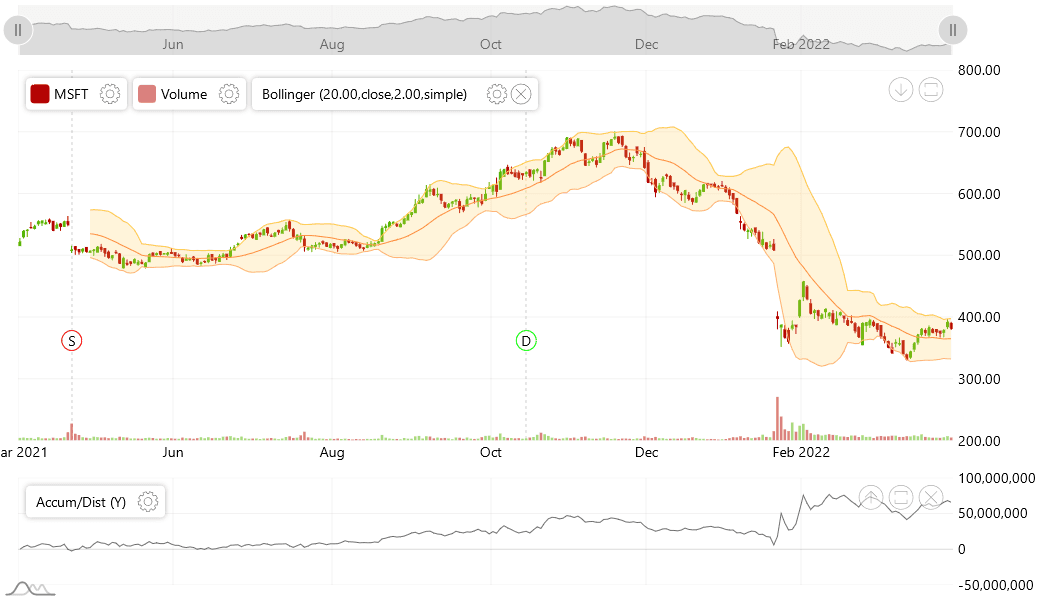
Stock Chart acts as a container wrapping multiple panels (StockPanel instances). Each panel is essentially an XY chart with synchronized zoom, pan, and cursor functionality, allowing complex visual combinations of multiple data sets.
Each panel includes a date-based X axis and a value-oriented Y axis tailored for plotting time-series financial data, ensuring proper scaling and positioning of data points.
You can add various series types (line, candlestick, OHLC, column) to panels and designate main value and volume series. Over 30 built-in indicators like Bollinger Bands, MACD, and Moving Averages analyze these series.
The component supports user-drawn annotations such as lines, shapes, and text bound to specific timestamps and values. It also provides advanced analytical drawing tools for trend lines and regression analysis.
The integrated toolbar offers controls for selecting drawing tools, adding indicators and comparison series, managing zoom and data granularity, and adjusting chart settings.
Zooming, panning, and cursor positions are synchronized across all panels. Custom zoom behavior ensures intuitive navigation, with options to customize zoom position relative to cursor or panel edges.
A specialized stock legend displays series and indicators with interactive controls for enabling, disabling, and editing visual properties directly from the legend interface.
Horizontal scrollbars linked to date axes enable smooth navigation through large datasets, with customizable positioning and integration in the component's tools container.
Developers can create custom indicators by extending base classes, integrating them with the chart's data and legend systems. Editable settings allow exposing configuration properties via UI modals.
Review the details below to ensure this product is supported within your environment.
amCharts 5: Stock Chart v5.5.3 adds support for the Stochastic Momentum Index indicator, helping users make more informed trading decisions.
amCharts, founded in 2006, is a leading creator of JavaScript charting libraries based in Lithuania. Its main library, amCharts 5, is actively developed and widely integrated with TypeScript, React, Angular, Vue, and plain JavaScript environments. amCharts libraries allow developers to build modern, customizable, and high-performance data visualizations including charts, maps, and infographics. With a focus on efficient rendering using the Canvas API, accessibility, and flexible theming, amCharts offers straightforward licensing and architecture that supports diverse visualization needs for web dashboards and interactive analytics.

As official and authorized distributors since 2019, ComponentSource supplies you with legitimate licenses directly from amCharts.