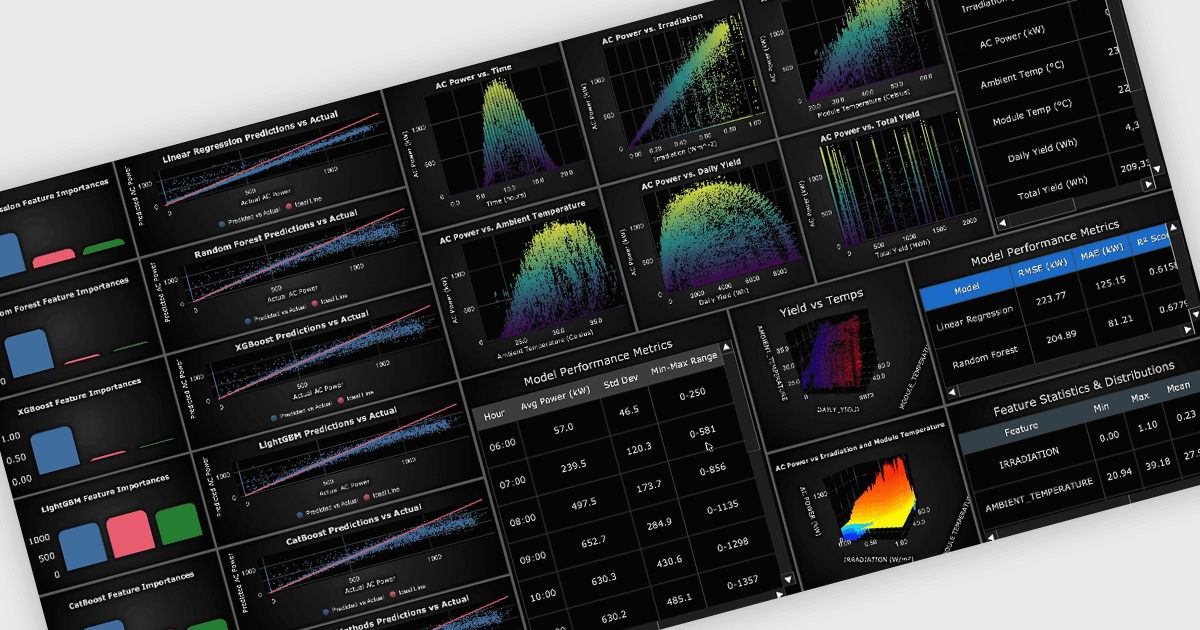
Visualize Metrics Clearly in a Structured DataGrid
LightningChart Python v2.1 adds a new DataGrid that presents KPIs, metrics, and in-cell visual trends in a single, fully customizable view.
High-performance, GPU-accelerated charts for Python data visualization.
Prices from:
| Available individually | Our Price |
|---|---|
| LightningChart Python | Loading |
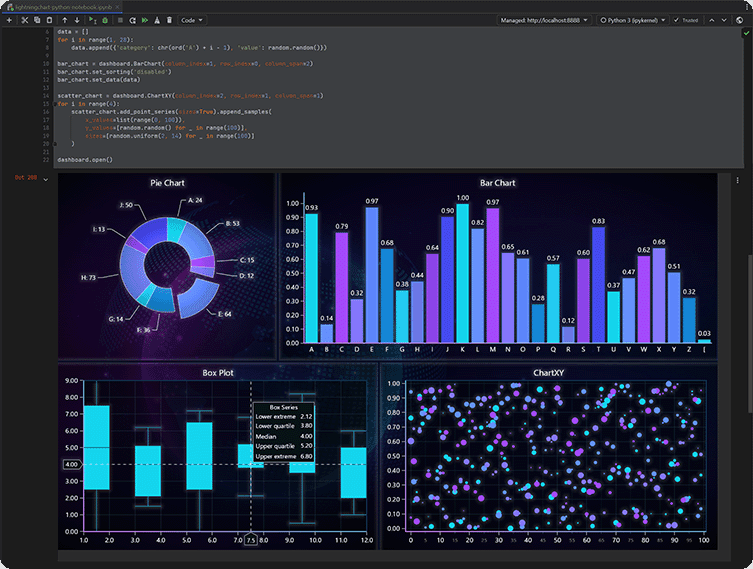
Uses GPU-based rendering to efficiently process and display complex datasets, delivering smooth performance and responsiveness even during intensive visualization tasks involving large volumes of data.
Supports continuous high-frequency data updates, enabling applications to visualize live and streaming data dynamically with minimal latency for monitoring and analytical scenarios.
Provides a range of visualization types including line, scatter, heatmap, and surface charts, supporting both two-dimensional and three-dimensional data representation.
Handles high-density datasets efficiently, allowing applications to render large volumes of data while maintaining clarity, performance, and responsiveness during interaction.
Includes interactive tools such as zooming, panning, and cursor tracking, enabling users to explore datasets and inspect specific values directly within visualizations.
Allows precise configuration of axes, coordinate systems, and scaling options to adapt visualizations to specific data ranges and analytical requirements.
Supports rendering of complex three-dimensional datasets, enabling detailed spatial analysis for scientific, engineering, and analytical use cases requiring depth and perspective.
Enables multiple datasets to be displayed simultaneously within a single chart, supporting comparison, correlation, and layered analysis across different data sources.
Provides heatmap and intensity-based visualization tools to represent data distribution, density, and variation across large datasets with complex value relationships.
Maintains accuracy when visualizing numerical data, supporting applications that require precise representation for scientific measurement, financial analysis, and engineering calculations.
Review the details below to ensure this product is supported within your environment.
LightningChart Python v2.1 adds a new DataGrid that presents KPIs, metrics, and in-cell visual trends in a single, fully customizable view.
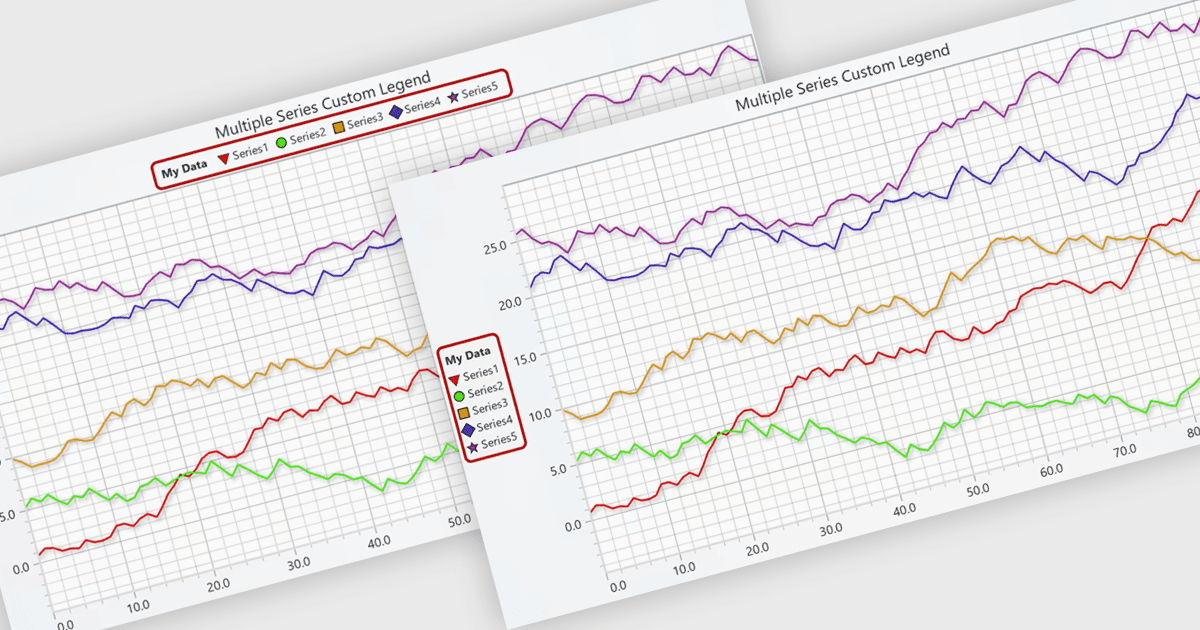
LightningChart Python v2.0 adds adaptive legend positioning with control over placement to optimize readability and create visually balanced charts.
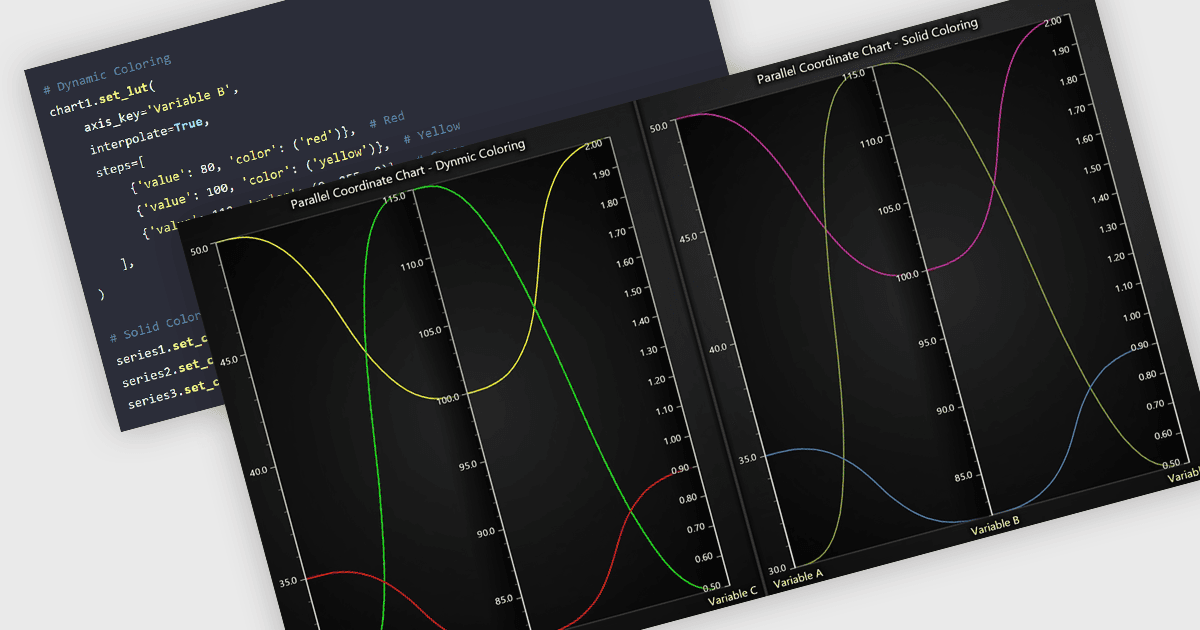
LightningChart Python v1.2 enables developers to add Parallel Coordinate charts to dashboards, making it easier to analyze multidimensional data.
LightningChart, founded in Finland, specializes in advanced data visualization libraries for developers and IT professionals. Since its inception, LightningChart has focused on delivering GPU-accelerated charting components for .NET, JavaScript, and Python, supporting web, desktop, server, and IoT environments. Its libraries are known for rapid rendering and the ability to handle massive datasets, making them popular in scientific, engineering, financial, and medical software. With a dedicated team and worldwide presence, LightningChart offers customizable visualization solutions that help users achieve exceptional performance and flexibility in modern application development.
Learn more about LightningChartExplore LightningChart products

As official and authorized distributors since 2021, ComponentSource supplies you with legitimate licenses directly from LightningChart.