


Proveedor oficial
Como distribuidores oficiales y autorizados, le suministramos licencias legítimas directamente de más de 200 editores de software.
Ver todas nuestras marcas.
Continuar leyendo en inglés:
TeeChart for .NET is a comprehensive charting solution that enables developers to create informative, visually compelling charts for financial, scientific, statistical, and business applications. It manages complex data and delivers interactive visualizations. With optional source code and enterprise editions that include mobile and JavaScript components, TeeChart for .NET provides flexibility, customization, and consistent charting across desktop, web, and mobile platforms.
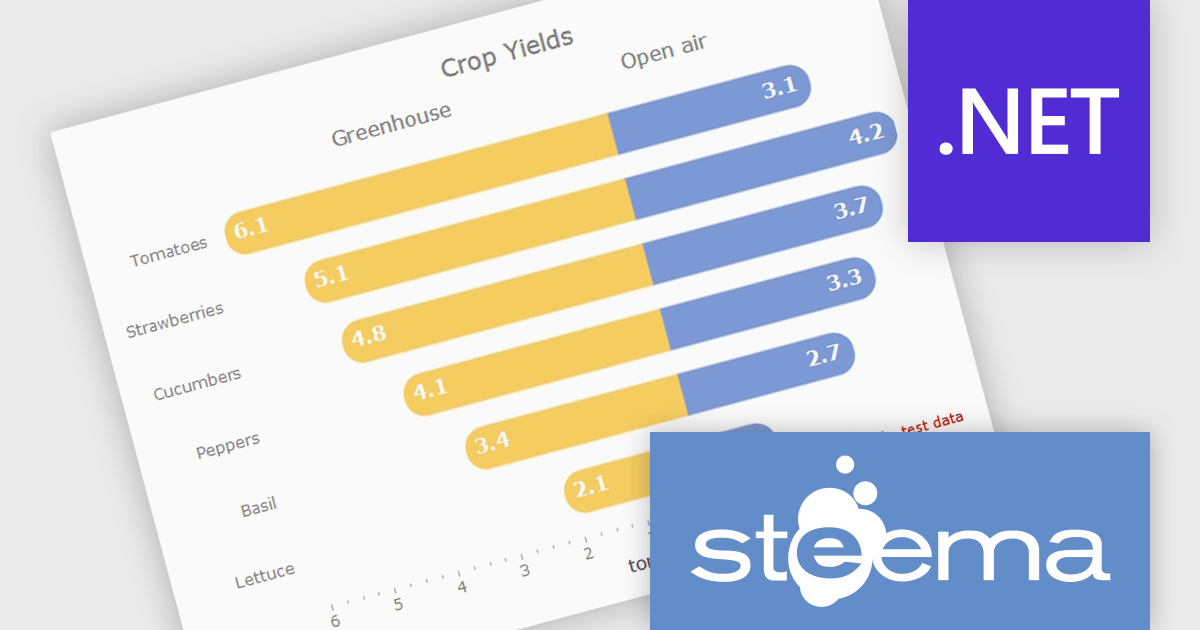
The TeeChart for .NET 2006 update introduces a Tornado Chart series type that enables developers to present structured side-by-side comparisons and perform sensitivity analysis. This chart type is particularly effective for highlighting the relative impact of multiple variables, making it well suited for financial modeling, risk assessment, and analytical dashboards. By offering built-in support within the existing TeeChart framework, it reduces the need for custom visualization logic, accelerates development time, and ensures consistent integration across reporting, analytics, and business applications.
To see a full list of what's new in version 2026, see our release notes.
TeeChart for .NET is licensed per developer and is available as a perpetual license. Each license includes one year of updates and upgrades. See our TeeChart for .NET Pro Edition licensing page for full details.
This update for TeeChart for .NET is available is available in the following products:
Tel: (888) 850 9911
Fax: +1 770 250 6199


