













Proveedor oficial
Como distribuidores oficiales y autorizados, le suministramos licencias legítimas directamente de más de 200 editores de software.
Ver todas nuestras marcas.
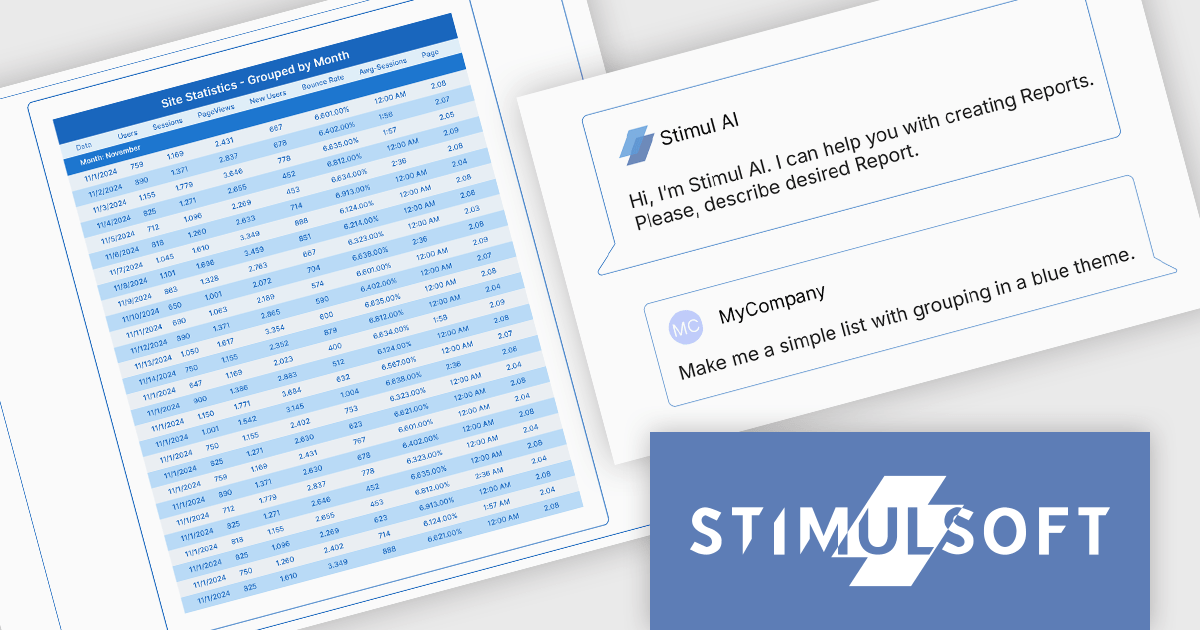
Stimulsoft BI Designer is a powerful reporting tool designed to create visually appealing and interactive reports. It allows users to design and develop complex reports with ease, integrating data from various sources and presenting it in a clear, concise, and informative manner. With its rich feature set, Stimulsoft BI Designer is widely used in diverse industries, including finance, healthcare, retail, and manufacturing, to generate reports for analysis, decision-making, and compliance purposes. Key benefits include its intuitive interface, extensive customization options, and support for multiple data sources, making it an essential tool for organizations seeking to enhance their reporting capabilities and gain valuable insights.
The Stimulsoft BI Designer 2025.4.1 update introduces an AI-powered Report Wizard that improves the report creation process for developers by transforming plain text queries into fully structured reports. It supports various report types, including simple lists, grouped, master-detail, and column-based formats, automatically analyzing connected data sources to generate accurate layouts. Developers can further refine and adjust report designs through custom queries, enabling efficient customization without manual configuration. This feature significantly reduces development time and enhances productivity within the Stimulsoft BI Designer environment.
To see a full list of what's new in 2025.4.1, see our release notes.
Stimulsoft BI Designer is available as a perpetual license and is licensed per creator. A creator is a person who creates reports, dashboards, or forms in a standalone (desktop) designer or online designer. The creator may install one copy of the standalone (desktop) designer. See our Stimulsoft BI Designer licensing page for full details.
Stimulsoft BI Designer is available individually or as part of Stimulsoft Ultimate.
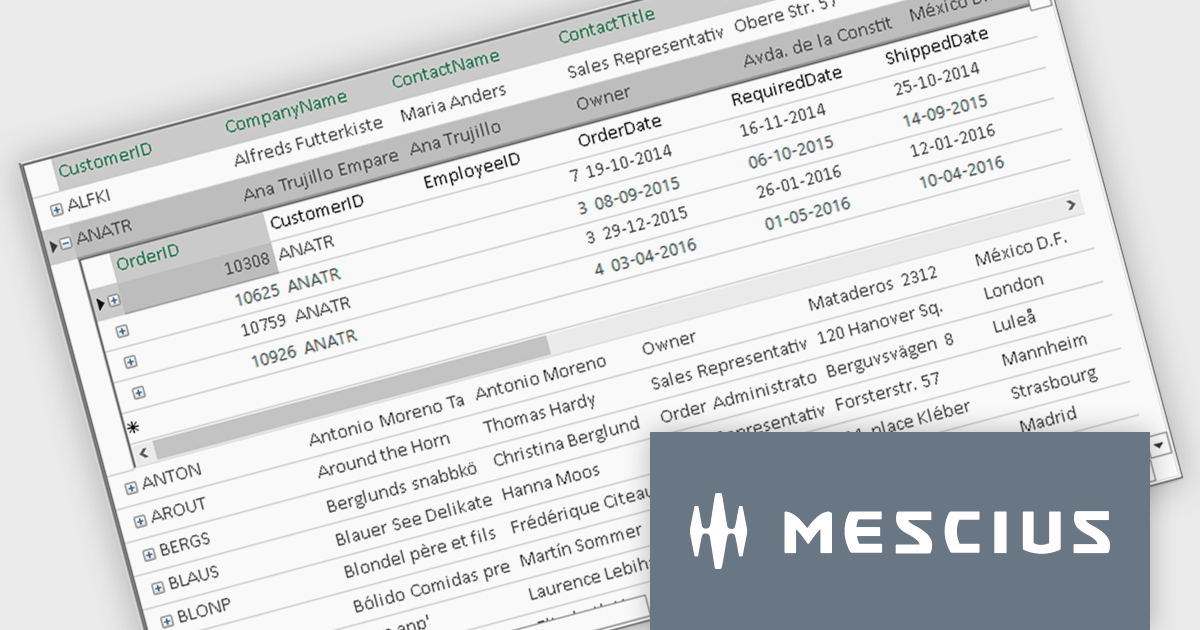
ComponentOne FlexGrid is a powerful Datagrid for your .NET WinForms applications, enabling .NET developers to display, edit, and analyze large data sets within a familiar Excel-like experience. It is optimized for high-performance and flexibility, allowing you to customize every aspect of the control.
On Wednesday, October 15th, at 11:00 AM EDT, MESCIUS (formerly GrapeCity) will be presenting a CodeClinic Live Webinar to demonstrate how you can upgrade your approach to data visualization through performance tuning, customized operations, and advanced data operations while learning practical tips and best practices. Key highlights include:
Register for the Live Webinar today and mark your calendar for October 15.
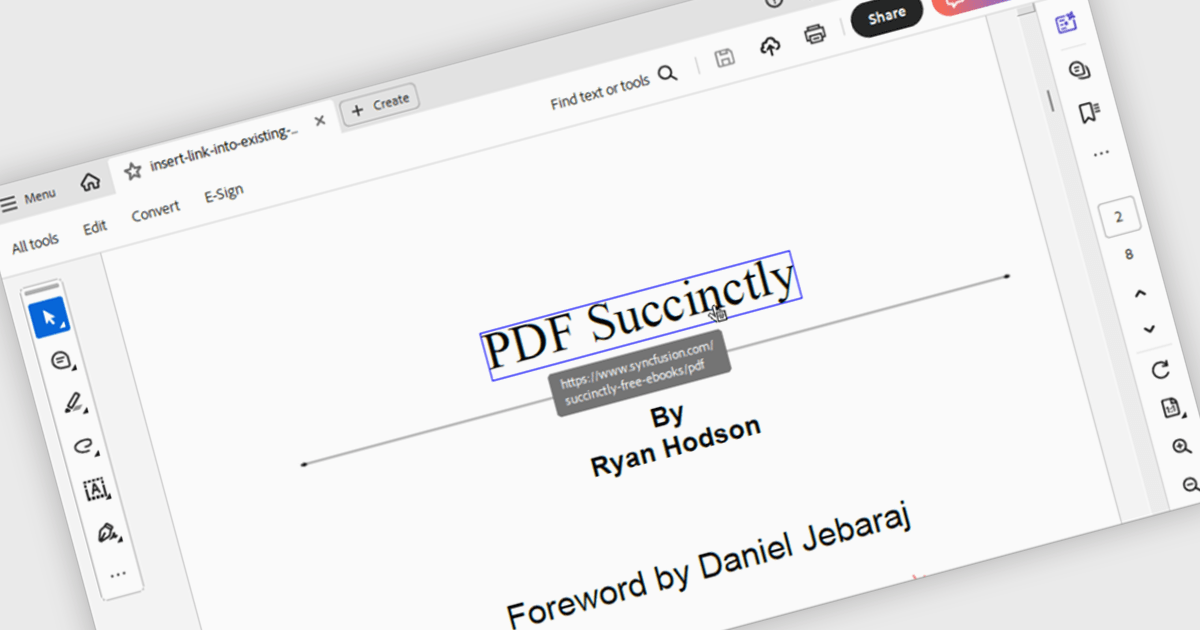
Hyperlink navigation in a PDF component refers to the ability to detect and interact with links embedded within a PDF document, allowing users to jump to external URLs, internal pages, or named destinations directly from the viewer. This functionality enhances the user experience by supporting transitions within or outside the document without manual scrolling or searching. For developers, it enables the creation of interactive documents and applications where navigation is intuitive, efficient, and consistent with modern document consumption expectations.
Several WinForms PDF components support hyperlink navigation, including:
For an in-depth analysis of features and price, visit our comparison of PDF components for WinForms.
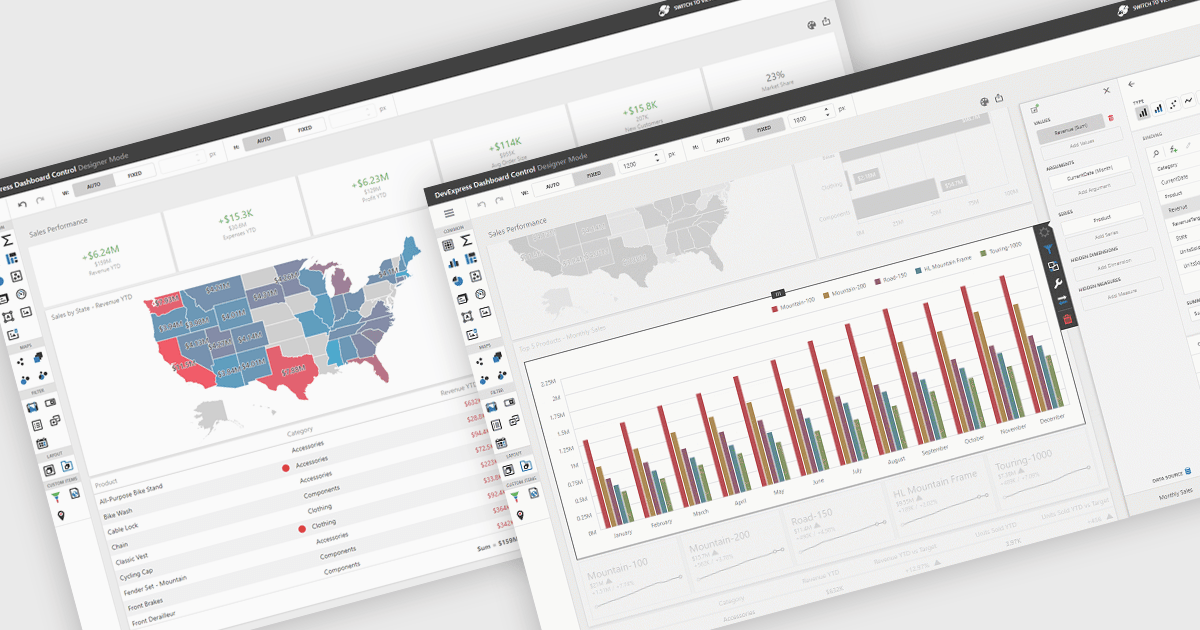
UI layouts define the structural arrangement of elements within an application, determining how content, controls, and navigation are organized and presented to users. A well-designed layout ensures consistency, responsiveness, and usability across different devices and screen sizes, making applications more intuitive and efficient to interact with. Benefits include improved user experience through predictable navigation and flexibility to scale as application requirements evolve. For example, dashboards can automatically adjust width and height to fit available space, web apps can employ responsive grid systems to adapt to mobile and desktop displays, and enterprise software can apply consistent layouts across modules to improve complex processes.
Several .NET WinForms UI suites offer layout components including:
For an in-depth analysis of features and price, visit our .NET WinForms UI suites comparison.
ComponentOne Studio Enterprise is a comprehensive suite of .NET UI controls developed by MESCIUS (formerly GrapeCity) designed for building rich, interactive desktop, web, and mobile applications. It provides developers with a broad range of tools and components-including data grids, charts, reports, input controls, and advanced data visualization features-for platforms such as WinForms, WPF, ASP.NET Core, Blazor, WinUI, and .NET MAUI. The suite emphasizes performance, flexibility, and ease of integration, helping teams create consistent, feature-rich user experiences across multiple application types while maintaining a unified development approach.
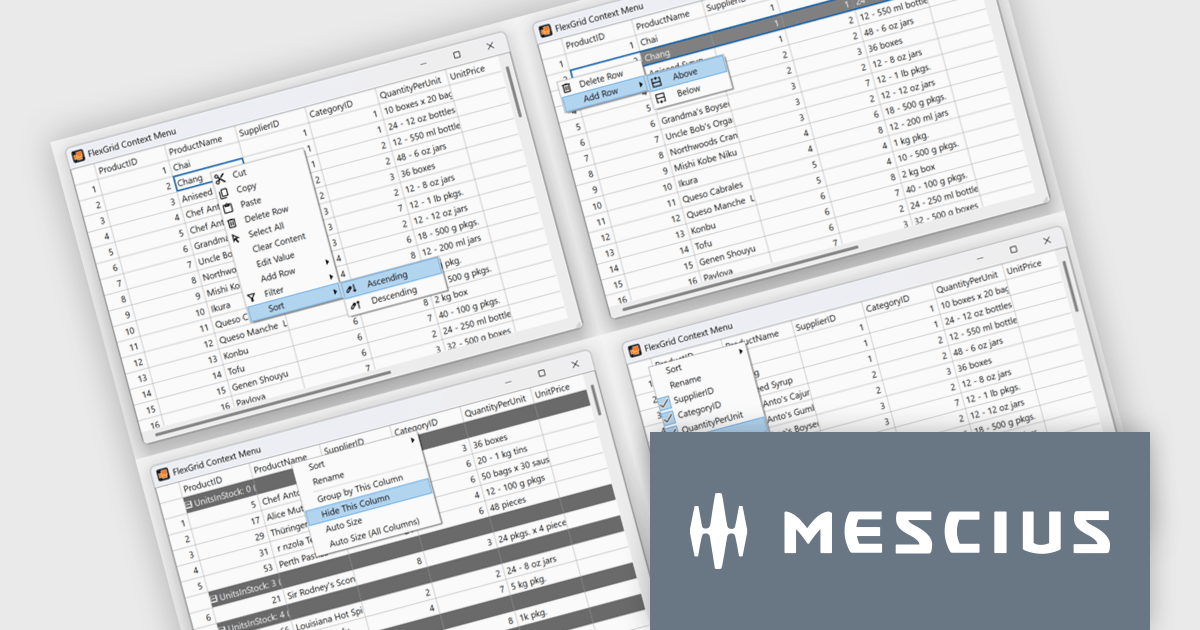
The ComponentOne 2025 v1.2 update includes a new sample demonstrating a complete, custom context menu solution for FlexGrid. It allows developers to define context-aware actions that adapt to different parts of the grid. This enables right-click functionality to insert rows, sort or group columns, and open a column picker directly within the grid. Developers benefit from the flexibility of FlexGrid’s API to implement tailored solutions while providing end users with a familiar, Excel-like experience that enhances efficiency and precision in data management tasks.
To see a full list of what's new in 2025 v1.2, see our release notes.
ComponentOne Studio Enterprise is licensed per developer on a perpetual basis and includes a 12 month subscription. Priority Support is also available. See our ComponentOne Studio Enterprise licensing page for full details.
Learn more on our ComponentOne Studio Enterprise product page.
Tel: (888) 850 9911
Fax: +1 770 250 6199


