


Proveedor oficial
Como distribuidores oficiales y autorizados, le suministramos licencias legítimas directamente de más de 200 editores de software.
Ver todas nuestras marcas.
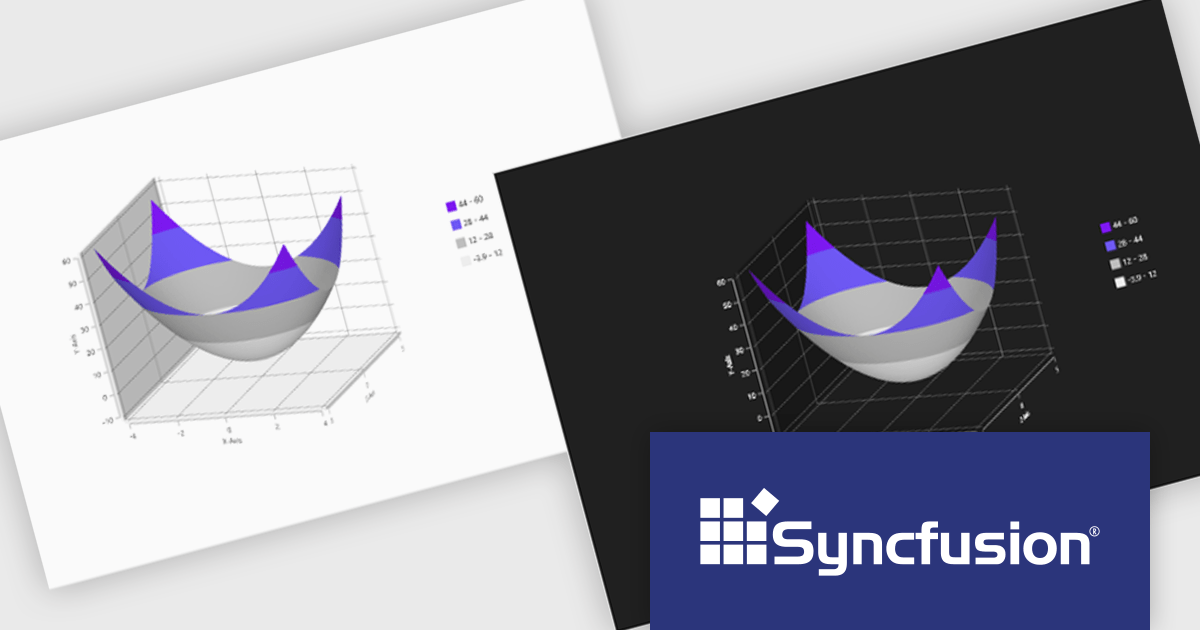
Syncfusion Essential Studio WPF, available as part of Syncfusion Essential Studio Enterprise, is a powerful suite of over 95 UI controls, 50+ charts, and document processing libraries designed to boost the development of high-performance line-of-business applications for the Windows Presentation Foundation (WPF) framework. With built-in themes, touch-friendly interfaces, and seamless Visual Studio integration, it empowers developers to craft modern, feature-rich, and cross-platform experiences with ease.
The Syncfusion Essential Studio WPF 2024 Volume 3 release adds theming support to the Surface Chart. By enabling the modification of color palettes, font styles, axis labels, and overall layout, theming empowers users to create visually striking and informative charts that align with specific branding guidelines or user preferences. This flexibility not only improves the chart's aesthetic quality but also contributes to a more engaging and intuitive user experience.
To see a full list of what's new in 2024 Volume 3, see our release notes.
Syncfusion Essential Studio WPF is available as part of Syncfusion Essential Studio Enterprise which is licensed per developer starting with a Team License of up to five developers. It is available as a 12 Month Timed Subscription License which includes support and maintenance. See our Syncfusion Essential Studio Enterprise licensing page for full details.
Learn more on our Syncfusion Essential Studio WPF product page.

A time picker (time editor) component allows users to select a specific time from a predefined range. It often presents a visual representation of time, such as a clock face or a digital display, and provides intuitive controls for adjusting hours, minutes, and sometimes seconds. This component simplifies time input and selection processes, enhancing user experience and reducing potential errors in applications that require precise time specification, such as scheduling tools, appointment booking systems, and time-based data entry forms.
Several WPF data editor collections feature a time editor, including:
For an in-depth analysis of features and price, visit our WPF data editors comparison.

Chart components with image export features empower users to save a chart's visual representation as a static image file, providing a convenient way to share, embed, or print data insights. This capability is valuable for developers and end-users alike, as it removes the need for access to the original dataset or charting software when distributing visualizations. With image export, users can preserve the chart's design, style, and formatting, ensuring that its presentation remains consistent across various platforms, from presentations to reports. Additionally, by offering support for standard formats such as PNG, JPEG, or SVG, this feature enables seamless integration of charts into documents, websites, or printed materials, enhancing flexibility and broadening the ways in which data insights can be shared and utilized.
Several WPF charting components support exporting to images including:
For an in-depth analysis of features and price, visit our comparison of WPF charting components.
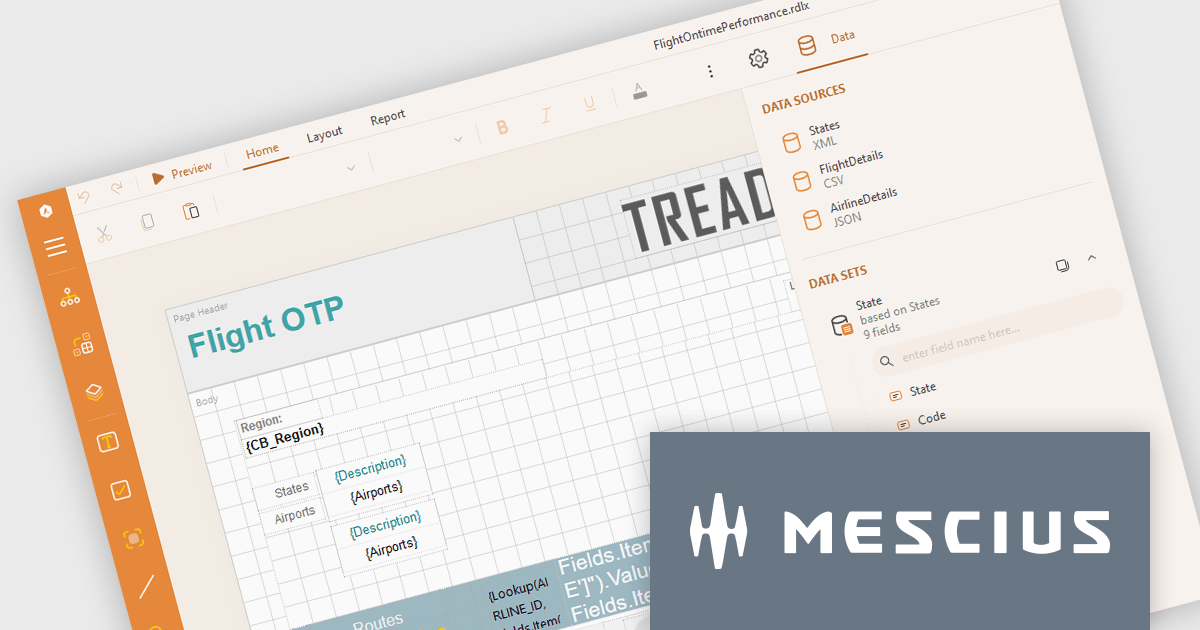
ActiveReports.NET from MESCIUS, is a comprehensive reporting solution for developers building applications in .NET. It empowers you to design and deliver visually appealing reports through user-friendly designers and a wide range of controls. ActiveReports simplifies report creation and distribution with a versatile API, rich data source connectivity, and support for multiple export formats. This translates to increased developer productivity and improved end-user experience with powerful reporting functionalities within your .NET applications.
The ActiveReports.NET v18.2 update enhances the XML Data Display in the Web Designer by introducing a tree structure for data fields, making it significantly easier to navigate and understand complex XML data. This intuitive format allows developers to quickly explore hierarchical data structures, streamlining the data binding process and reducing the effort required to interpret XML data. As a result, developers can focus more on designing reports efficiently rather than spending time deciphering the data itself, leading to a more productive and user-friendly report development experience.
To see a full list of what's new in 18.2, see our release notes.
ActiveReports.NET is licensed per developer and is available with or without a 12 month support and maintenance subscription. See our ActiveReports.NET licensing page for full details.
Learn more on our ActiveReports.NET product page.

Read-only columns in a data grid are vertically displayed fields that are not editable by users, but can still be viewed. These columns typically display information that is derived from other data or is considered static and should not be altered. By stopping users from directly modifying certain content, developers can ensure data integrity and consistency while still providing full visibility. This feature prevents accidental or intentional changes that might disrupt the system's functionality. Such restrictions streamline workflows by distinguishing between editable and non-editable data, reducing the risk of errors and improving overall system reliability.
Several WPF grid components allow you to display read-only columns, including:
For an in-depth analysis of features and price, visit our comparison of .NET WPF grid components.
Tel: (888) 850 9911
Fax: +1 770 250 6199


