













Proveedor oficial
Como distribuidores oficiales y autorizados, le suministramos licencias legítimas directamente de más de 200 editores de software.
Ver todas nuestras marcas.
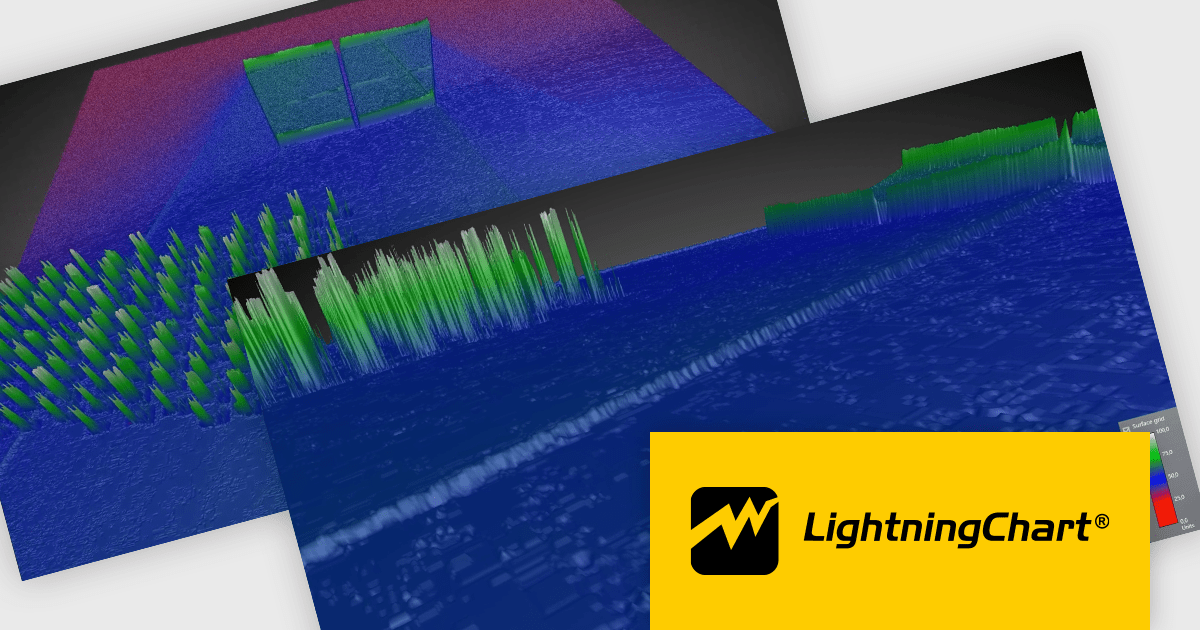
LightningChart .NET is a high-performance data visualization library designed for .NET developers working with WPF, WinForms, and UWP applications. It offers GPU-accelerated rendering for smooth real-time visualization of massive datasets, exceeding billions of data points. This library supports a wide variety of chart types, including 2D, 3D, polar, and geographic maps, along with extensive customization options for each. LightningChart .NET is a powerful tool for developers creating demanding data visualization applications requiring exceptional performance.
The LightningChart .NET v12.1.1 update delivers a substantial performance boost to 3D interactions, particularly for large surface-rendering objects such as SurfaceGridSeries3D, SurfaceMeshSeries3D, and MeshModel. This improvement allows for faster zooming, rotating, and panning, significantly enhancing the efficiency of workflows involving complex 3D models. Developers working on mid-level systems will experience at least double the performance, while high-end graphics setups can achieve up to a tenfold increase in speed. These optimizations enable smoother and more responsive interaction with large datasets, leading to more productive and seamless user experiences when working in demanding 3D environments.
To see a full list of what's new in v12.1.1, see our release notes.
LightningChart .NET is available per developer in packages for either WPF, WinForms, UWP or all 3. Each package comes as a subscription license (with 1 or 2 years of limited support), or a perpetual license (with 1 or 2 years of Standard or Premium support). Floating licenses and site licenses are available upon request. See our LightningChart .NET licensing page for full details.
Learn more on our LightningChart .NET product page.
List & Label by combit is a software development toolkit that empowers developers to integrate comprehensive reporting functionalities into their desktop, web, and cloud applications. It offers features such as data binding, complex data visualization, and a user-friendly report designer, along with printing, exporting, and previewing capabilities. List & Label operates independently of programming languages and data sources, providing developers with the flexibility to design and deliver informative reports within their development environment.
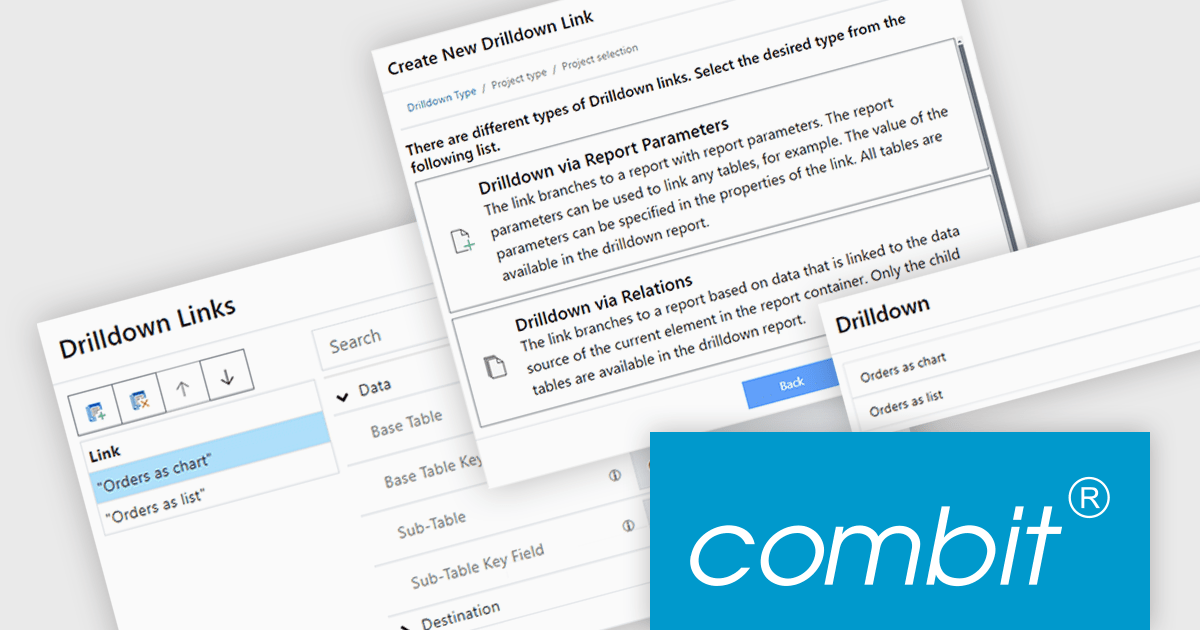
The List & Label version 30 update introduces the drilldown function to the Web Report Designer. This enables users to explore data hierarchies directly within web-based reports, allowing for more in-depth analysis by drilling down into detailed data layers without leaving the report context. Drilldown functionality enables developers to create interactive web reports, which provides users with a more intuitive and engaging experience when interacting with large and complex datasets.
To see a full list of what's new in version 30, see our release notes.
List & Label is licensed per developer and is available as a Perpetual License with a 12 month support and maintenance subscription. See our List & Label licensing page for full details.
List & Label is available in the following products:

FastReport .NET is a comprehensive reporting solution for .NET applications, offering a wide range of tools for creating, managing, and delivering reports. This software is designed to enable developers to integrate complex reporting functionalities directly into their .NET projects. Key features of FastReport .NET include an intuitive visual report designer, a powerful data processing engine, and support for a variety of export formats such as PDF, Excel, and Word. The product also supports data connectivity from multiple sources, including databases, XML files, and JSON. With its robust scripting capabilities, customizable templates, and ability to generate interactive reports, FastReport .NET provides developers with a versatile toolset for building high-performance, professional-grade reports suitable for business intelligence, data analysis, and presentation needs.
The FastReport .NET 2025.1 update introduces a valuable new feature that allows developers to add a report page as a link, instead of inserting the page into the report. This enhances report modularity and flexibility allowing developers to integrate external report pages into existing reports without duplicating content, simplifying maintenance and updates. By linking report pages, developers can efficiently reuse content across multiple reports, ensuring consistency while reducing the need for repetitive configuration. This feature is particularly advantageous for complex reporting scenarios where maintaining a single source of truth is essential.
To see a full list of what's new in 2025.1, see our release notes.
FastReport .NET is licensed per named user with options for Single, Team or Site Licenses. See our FastReport .NET Component Packages licensing page for full details.
Learn more on our FastReport .NET Component Packages product page.
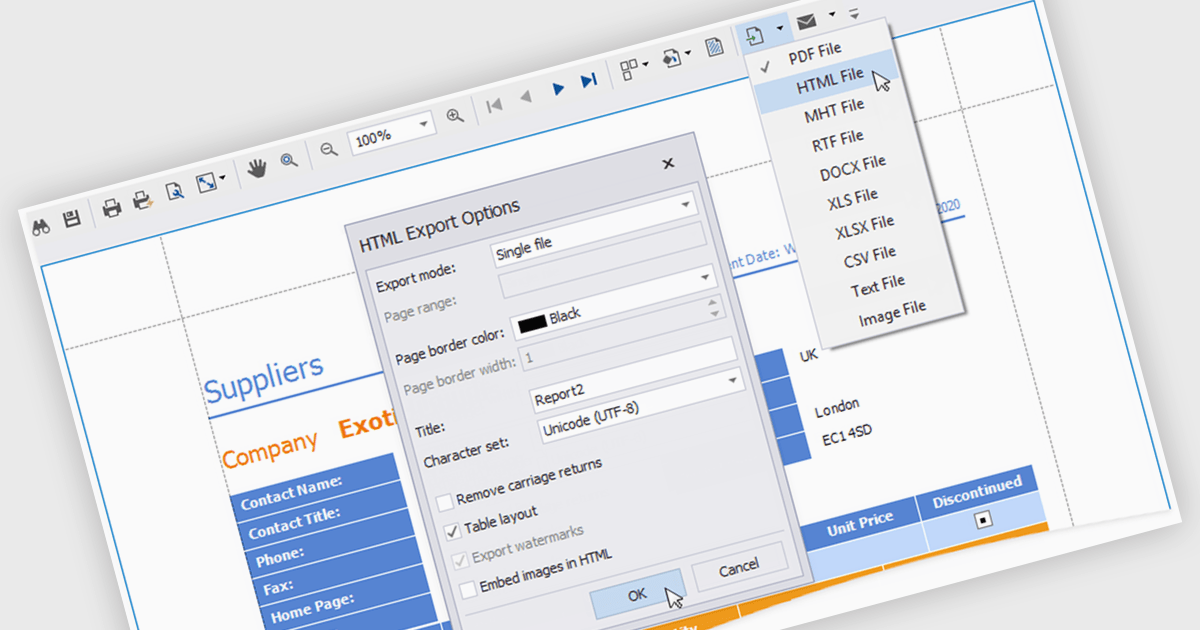
HTML export offers a versatile and accessible solution for sharing and distributing data-driven report insights. Transforming complex data into human-readable HTML format enables stakeholders to easily view, understand, and interact with reports. This functionality is particularly valuable for teams that need to collaborate on analysis or share findings with individuals who may not have access to specialized reporting tools. HTML exports can be integrated into various platforms, such as websites, emails, or shared documents, making it a convenient method for disseminating information and promoting data-driven decision-making.
Several .NET WPF reporting controls offer HTML exporting including:
For an in-depth analysis of features and price, visit our WPF Reporting controls comparison.
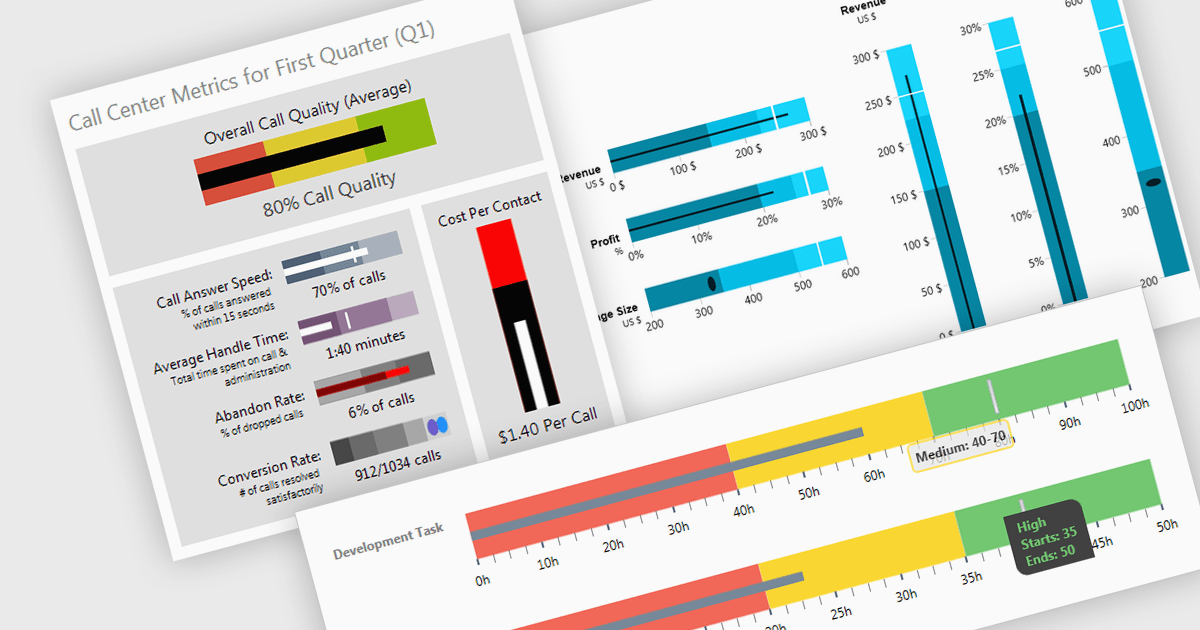
A bullet chart (or bullet graph) is a streamlined bar chart that effectively conveys key performance metrics in relation to targets. It features a single bar representing the main value, overlaid with shaded regions indicating qualitative ranges (e.g., "poor," "average," "good"), and a line marking the target. This minimalist design offers a clear, at-a-glance assessment of performance, making it well-suited for dashboards and reports where space is limited and focus on essential metrics is paramount.
Several WPF charting components support bullet graphs:
For an in-depth analysis of features and price, visit our comparison of WPF charting components.
Tel: (888) 850 9911
Fax: +1 770 250 6199


