


Proveedor oficial
Como distribuidores oficiales y autorizados, le suministramos licencias legítimas directamente de más de 200 editores de software.
Ver todas nuestras marcas.
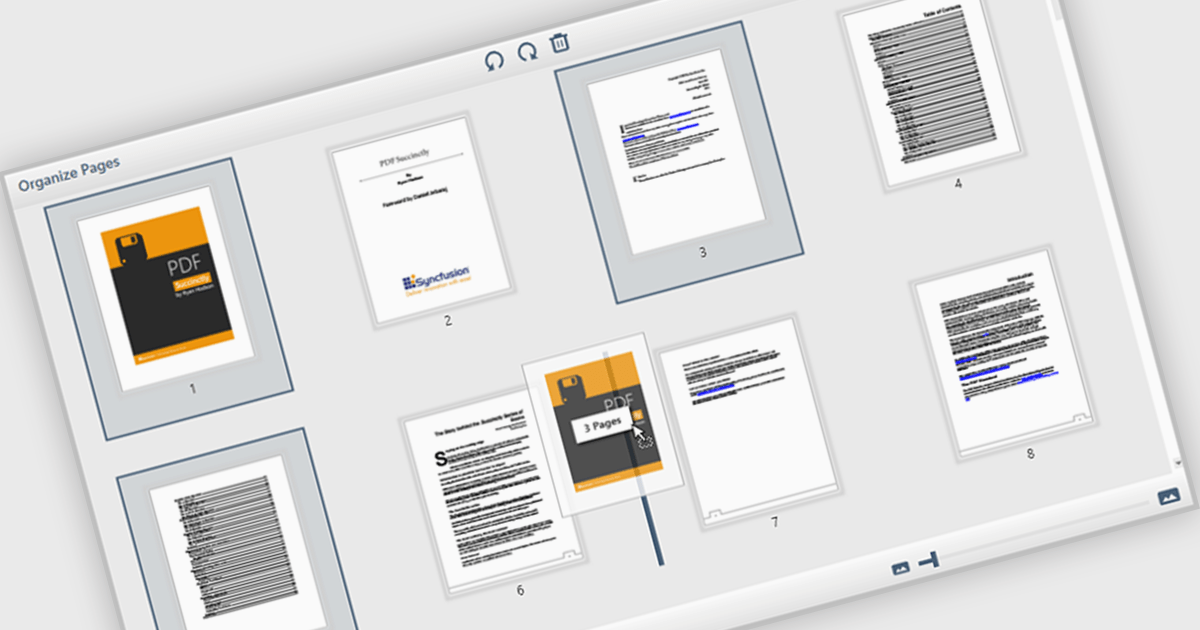
The ability to move and arrange pages in a PDF viewer allows users to reorder individual pages within a PDF document directly through the interface. For software developers, this feature supports more dynamic document processes, especially in applications involving content assembly, form management, or automated report generation. It reduces the need for external tools or manual editing, which simplifies integration and enhances user experience when managing complex or multi-page documents.
Several WPF (Windows Presentation Foundation) PDF viewer components allow you to move and arrange pages in a PDF, including:
For an in-depth analysis of features and price, visit our WPF PDF viewer comparison.
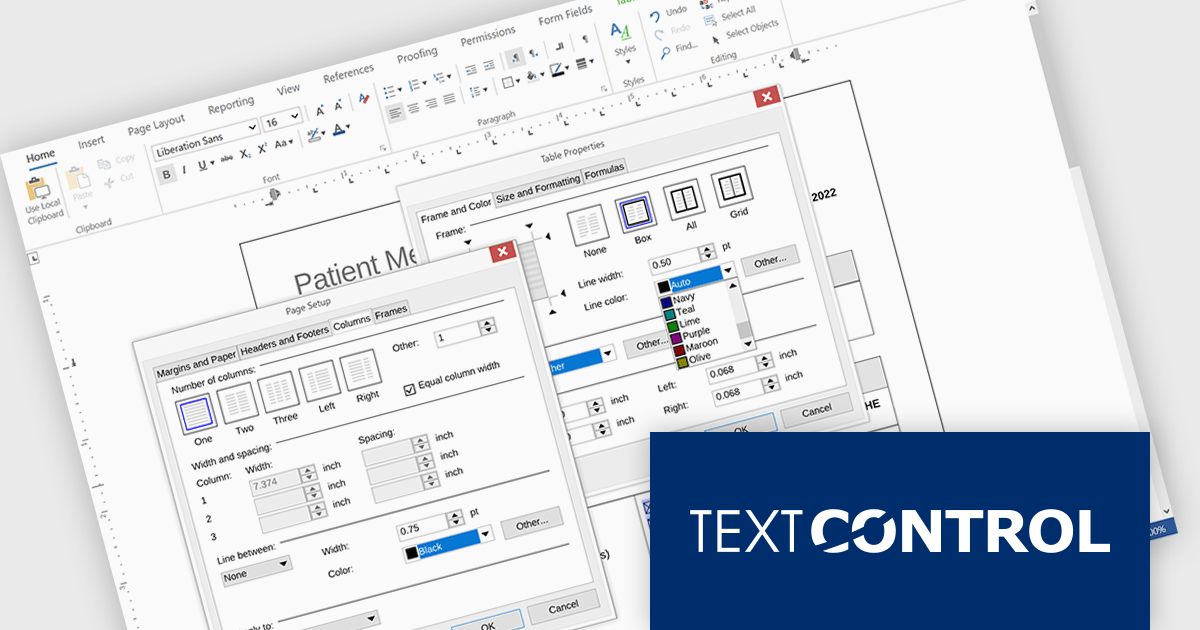
TX Text Control .NET Server for ASP.NET is a server-side component that equips your web applications with a powerful, Microsoft Word-compatible document editor. This allows you to develop applications that generate and edit various document formats (RTF, DOCX, PDF, etc.) on the fly, using data from databases or files. It also boasts features like PDF generation and a browser-based editor with a familiar MS Word-inspired interface, ultimately enhancing the document processing capabilities of your web applications.
The TX Text Control .NET Server for ASP.NET 34.0 release brings full dialog box support to Linux, aligning its functionality with Windows to offer a seamless experience across platforms. Developers building cross-platform applications can now rely on consistent, familiar interfaces for setting table attributes, image properties, and other document-related tasks. This update removes a key limitation for Linux deployments, making it easier to maintain UI consistency and improving the overall usability for end users. By ensuring parity in dialog box functionality, the release simplifies application logic and enhances user interaction across environments.
For a full list of changes in TX Text Control .NET Server for ASP.NET 34.0, see our release notes.
TX Text Control .NET Server for ASP.NET is licensed per developer and is available as a Perpetual License with a 12 month support and maintenance subscription. Run time licenses are required for the deployment to production servers. See our TX Text Control .NET Server for ASP.NET licensing page for full details.
For more information, visit our TX Text Control .NET Server for ASP.NET product page.
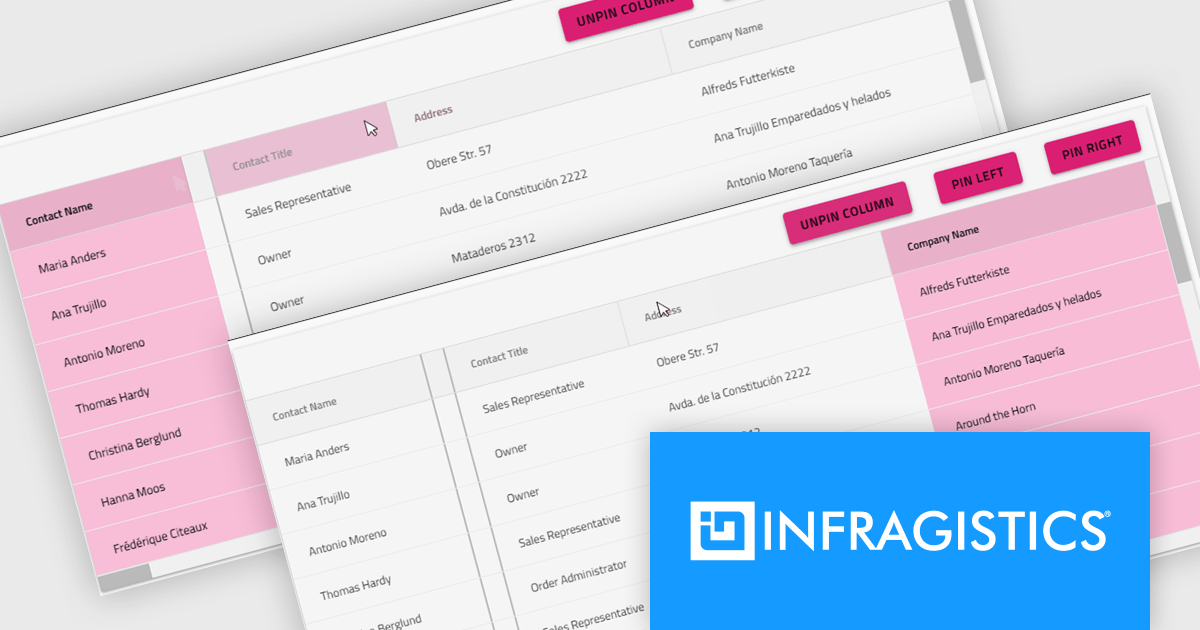
Infragistics Ultimate is a comprehensive development toolkit designed to streamline the creation of high-performance, visually rich applications across multiple platforms. It includes a wide range of user interface (UI) components and development tools for web, desktop, and mobile applications, supporting frameworks such as Angular, React, Blazor, .NET, and more.
The Infragistics Ultimate 25.2 release includes a feature that lets developers specify individual pinning locations for each grid column, making it possible to fix important data on both the left and right edges of a grid. This added flexibility helps create cleaner, more efficient layouts that keep key information visible at all times. Whether you’re working in Angular, React, Web Components, or Blazor, this capability improves data presentation, simplifies large dataset navigation, and enhances the overall usability of modern web applications.
To see a full list of what's new in version 25.2, see our release notes.
Infragistics Ultimate is licensed per developer and is available as a Perpetual License with a 1, 2 or 3 year support and maintenance subscription. See our Infragistics Ultimate licensing page for full details.
For more information, visit our Infragistics Ultimate product page.
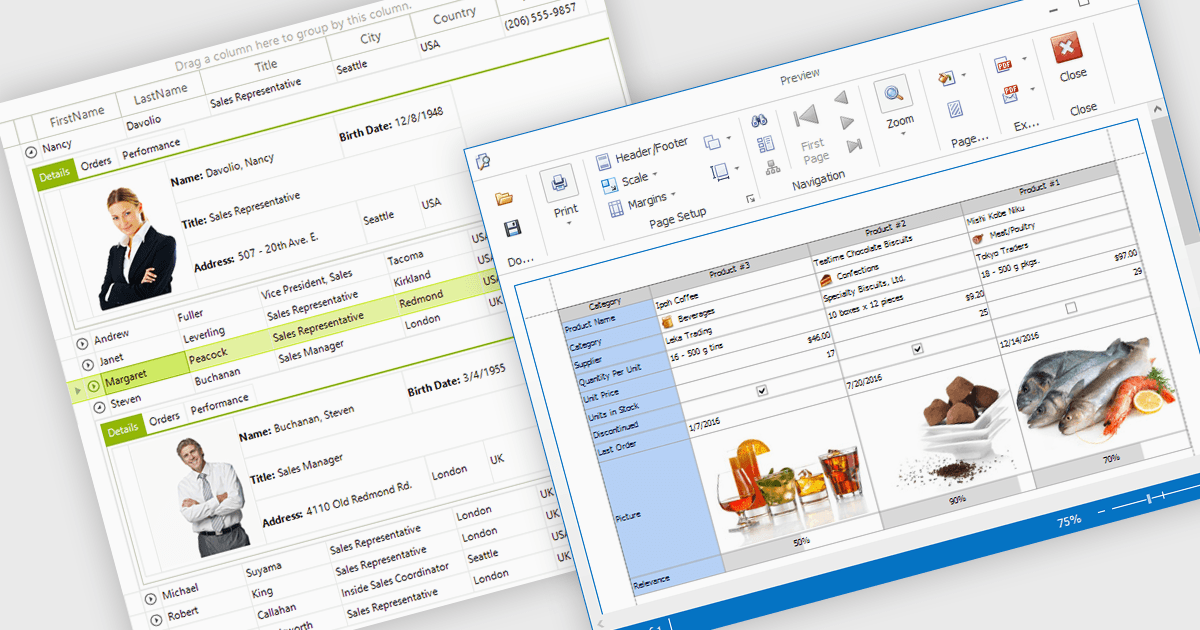
Displaying an image within a grid cell allows developers to combine visual and textual data, making information more intuitive and engaging. This feature enables images such as icons, product photos, or user avatars to appear directly alongside related values, providing immediate visual context and helping users quickly interpret complex datasets. The result is a more dynamic and user-friendly interface that enhances clarity, recognition, and overall usability. Common use cases include showing product images in inventory lists, employee photos in directories, or country flags in international sales reports, allowing users to connect visuals with data for faster understanding and improved decision-making.
Many .NET WinForms grid controls support displaying images within cells, including:
For an in-depth analysis of features and price, visit our comparison of .NET WinForms Grid Controls.
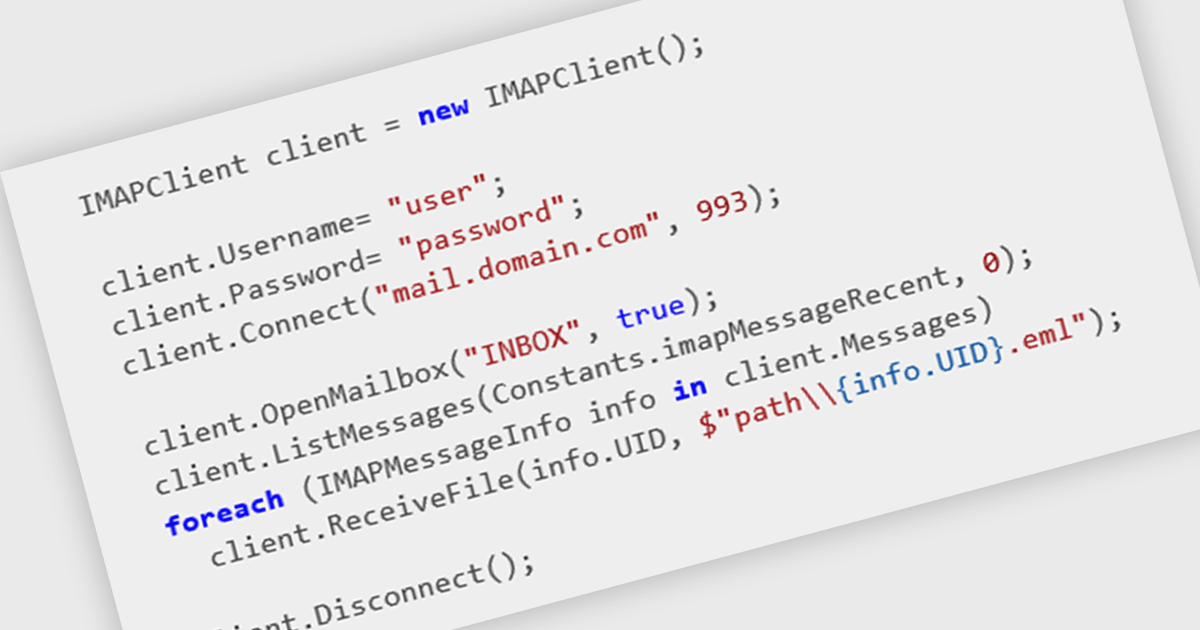
IMAP support enables applications to interact with mail servers using the Internet Message Access Protocol, allowing messages to be retrieved, searched, and managed directly on the server. This protocol maintains synchronization between the client and the server, preserving message state across multiple devices. For developers, integrating IMAP provides a consistent way to access and manipulate email data without requiring full message downloads, reducing local storage needs and improving responsiveness in applications that handle email communication.
Several .NET Comms & Messaging components offer IMAP support including:
For an in-depth analysis of features and price, visit our comparison of .NET Comms & Messaging.
Tel: (888) 850 9911
Fax: +1 770 250 6199


