


Proveedor oficial
Como distribuidores oficiales y autorizados, le suministramos licencias legítimas directamente de más de 200 editores de software.
Ver todas nuestras marcas.
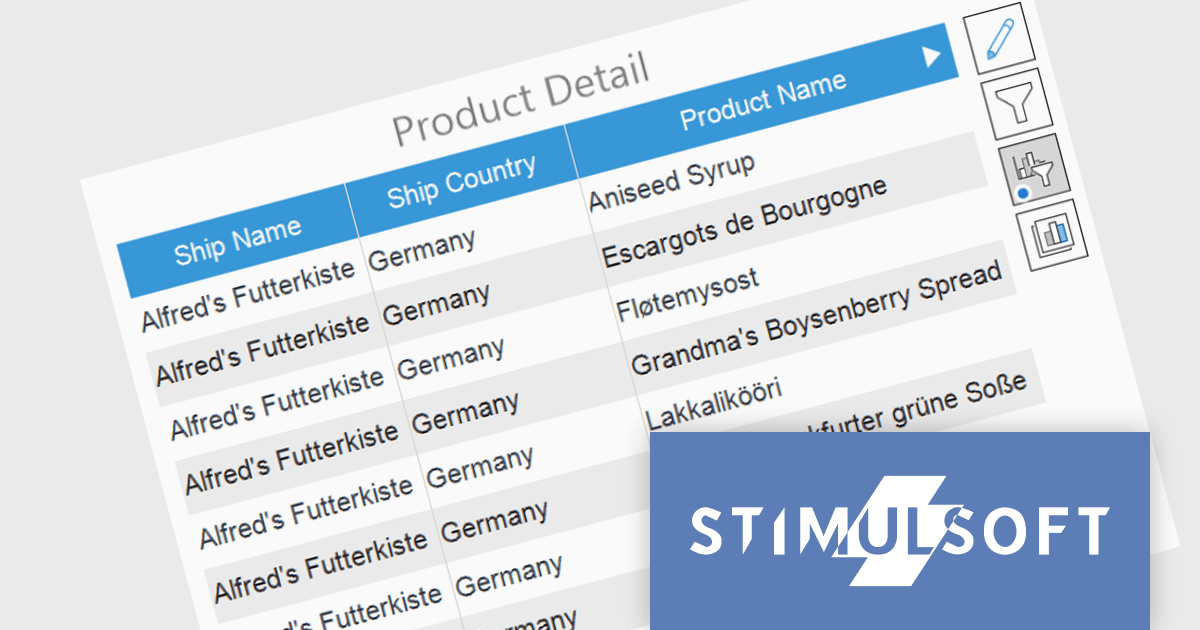
Stimulsoft Dashboards is a versatile suite of tools for crafting interactive data visualizations for web and desktop applications. It empowers developers to embed intuitive dashboards across various platforms, including .NET, JavaScript, and PHP, using the platform-specific components or a centralized cloud designer. With rich data analysis elements, extensive customization options, and pre-built templates, Stimulsoft Dashboards helps you transform complex data into clear, actionable insights for any audience.
The Stimulsoft Dashboards 2024.1.1 update adds the option to include custom filters for the Table element in dashboards. When filters are applied to the table, a dedicated control element lets you easily edit and remove user filters with a single click. This intuitive addition streamlines workflow, keeps you focused, and ensures your dashboards always reflect the exact insights you need.
To see a full list of what's new in version 2024.1.1, see our release notes.
Stimulsoft Ultimate is licensed per developer and is available as a Perpetual license with 1 year support and maintenance. See our Stimulsoft Ultimate licensing page for full details.
Stimulsoft Dashboards is available to buy in the following products:
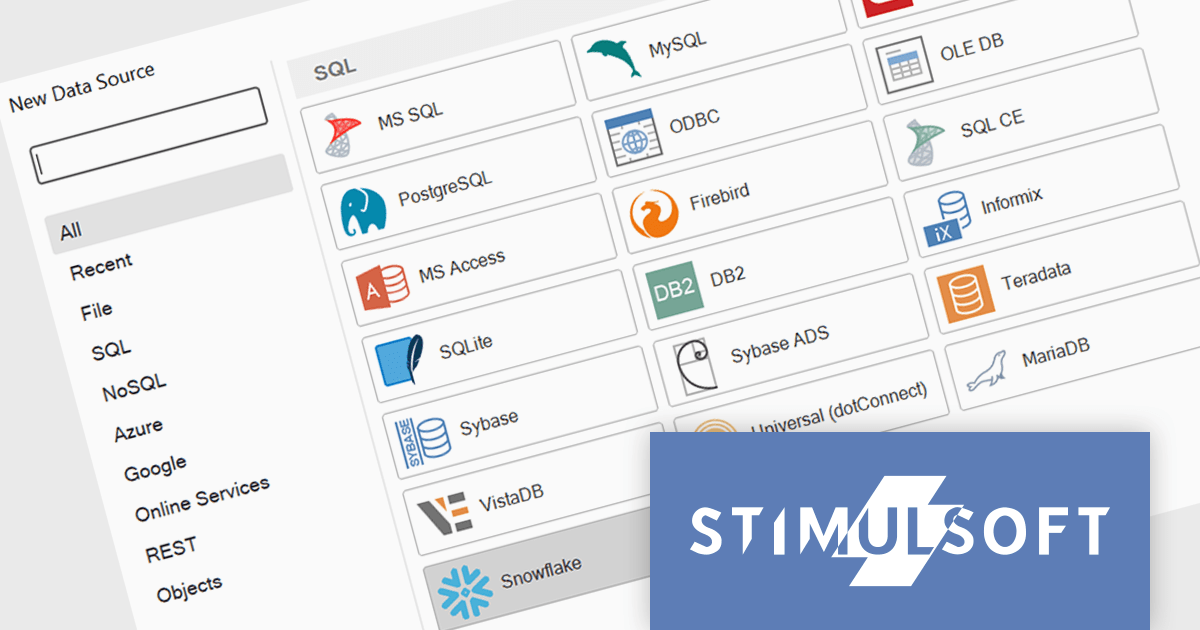
Stimulsoft Reports is a versatile reporting tool that lets you create and generate reports of any complexity from scratch, whether for desktop, web, or mobile platforms. It provides a visual designer and royalty-free runtime that integrates seamlessly with various frameworks like ASP.NET, Java, and JavaScript, empowering applications to generate insightful reports with rich features and diverse export options.
The 2024.1.1 release of Stimulsoft Reports adds a new data adapter for Snowflake, a widely used cloud data storage services, adept at handling both semi-structured and structured data. Developers can now utilize Stimulsoft's robust reporting capabilities to analyze Snowflake data directly, eliminating the need for manual data extraction or intermediary tools. This translates to faster report generation, improved data accuracy, and seamless integration with Snowflake's powerful cloud storage and performance.
To see a full list of what's new in version 2024.1.1, see our release notes.
Stimulsoft Ultimate is licensed per developer and is available as a Perpetual license with 1 year support and maintenance. See our Stimulsoft Ultimate licensing page for full details.
Stimulsoft Reports is available to buy in the following products:
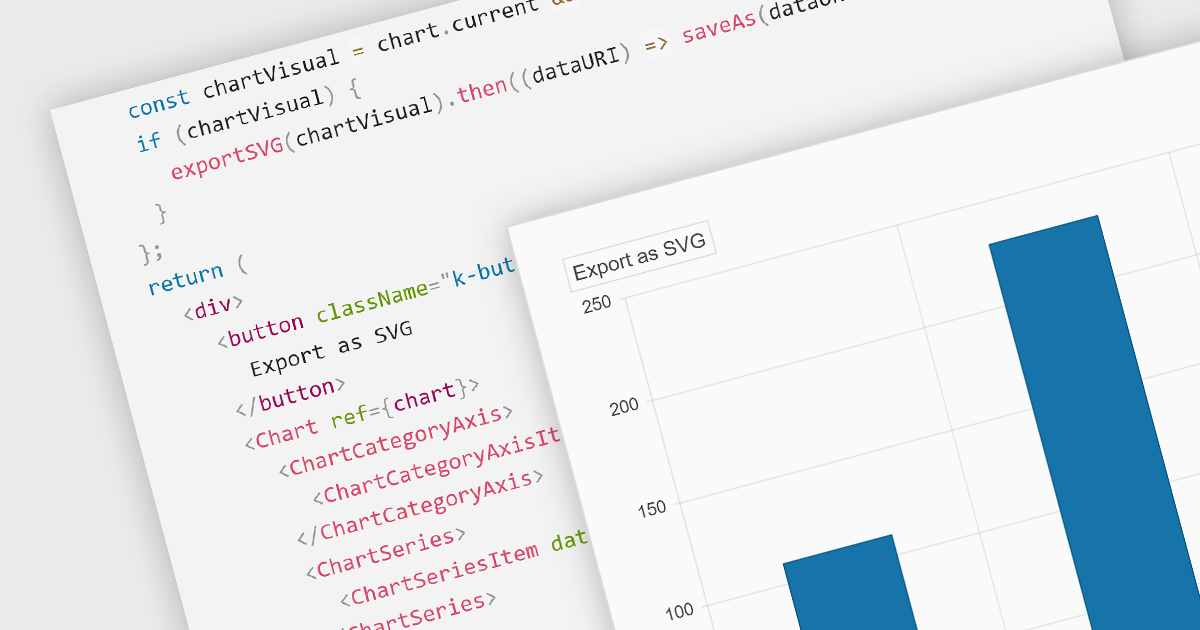
Exporting charts to SVG (Scalable Vector Graphics) format is vital for maintaining high-quality visuals in digital formats. SVGs are resolution-independent, meaning they retain their quality at any size, which is crucial for presentations or reports that might be viewed on different devices. This feature allows users to share their charts outside the chart creation tool while ensuring visual fidelity and sharpness.
Several React chart controls offer support for exporting to SVG including:
For an in-depth analysis of features and price, visit our React chart controls comparison.
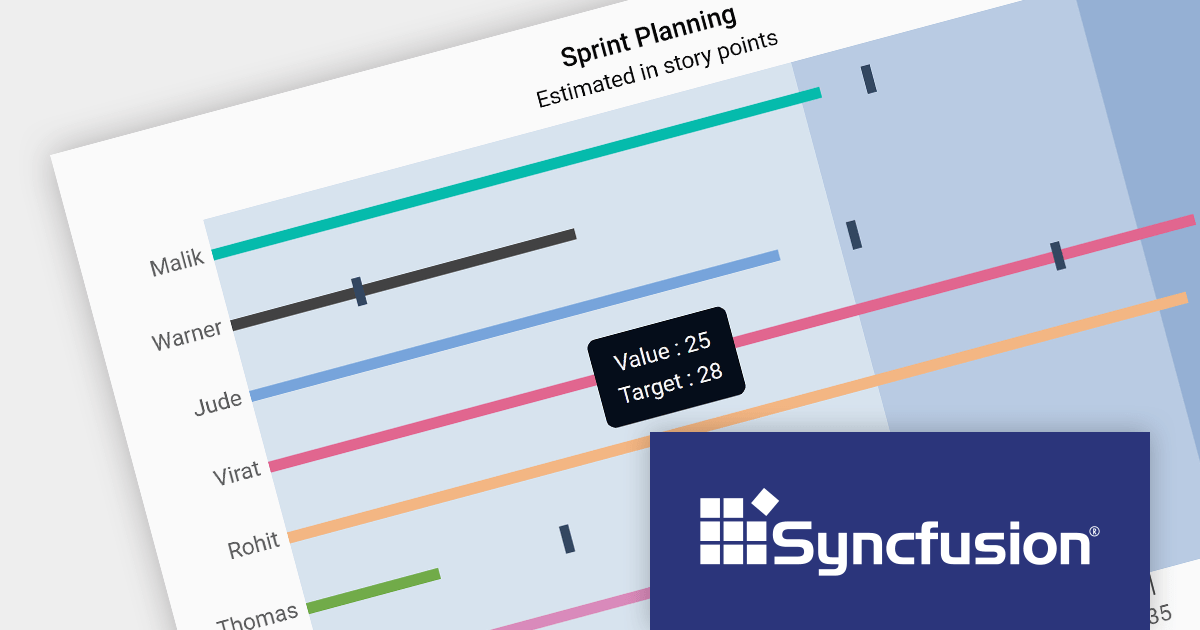
Syncfusion Essential Studio JavaScript, available as part of Syncfusion Essential Studio Enterprise, is a comprehensive UI library offering over 80 high-performance, lightweight, and responsive components to transform your web apps. Built from scratch with TypeScript, it boasts modularity and touch-friendliness, letting you pick and choose specific features while ensuring smooth mobile interaction. With rich themes, global accessibility features, and extensive documentation, it powers everything from basic buttons to interactive charts and data grids, simplifying frontend development across JavaScript, Angular, React, and Vue.
Version 2023 Volume 4 (24.1.41) adds the ability to customize your bullet charts by assigning specific colors to individual value and target bars. Bullet charts are a concise and data-rich visualization tool ideal for dashboards and performance presentations. They efficiently display several key metrics within a single bar, allowing for swift comparison between a primary measure, target values, and qualitative performance ranges. By combining visual cues like color and bar lengths, bullet charts enable rapid interpretation of data, making them perfect for decision-makers who need to grasp complex information at a glance.
To see a full list of what's new in version 2023 Volume 4 (24.1.41), see our release notes.
Syncfusion Essential Studio JavaScript is available as part of Syncfusion Essential Studio Enterprise which is licensed per developer starting with a Team License of up to five developers. It is available as a 12 Month Timed Subscription License which includes support and maintenance. See our Syncfusion Essential Studio Enterprise licensing page for full details.
For more information, visit our Syncfusion Essential Studio JavaScript product page.
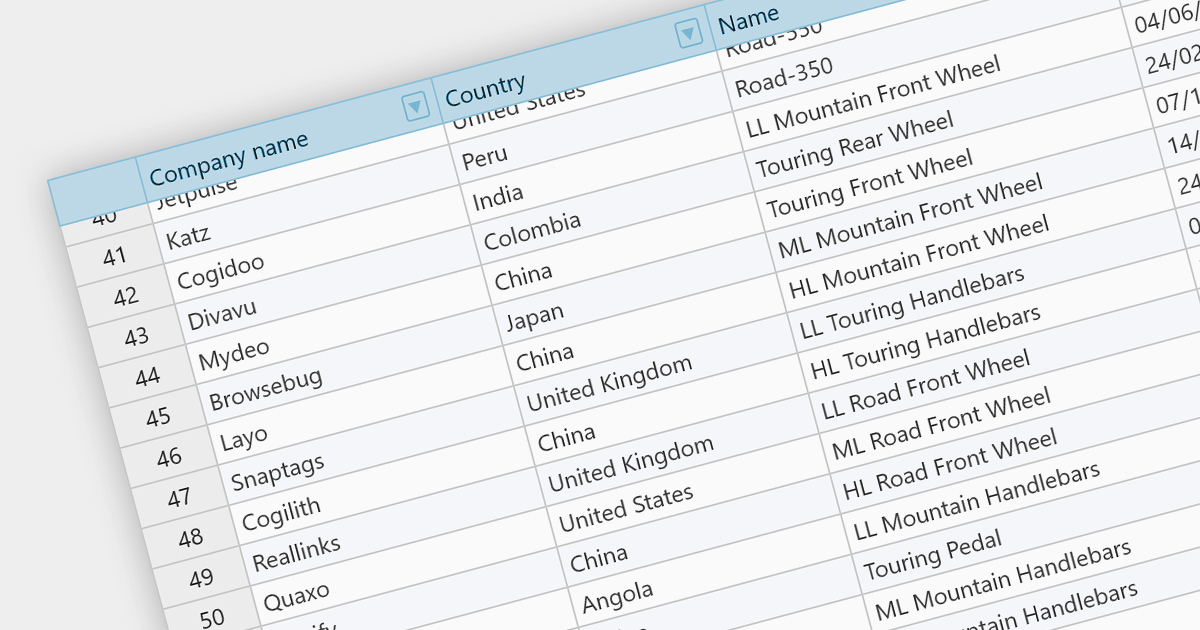
Fixed headers are a user interface element found in grids, particularly those managing large datasets. They comprise the top section of the grid, typically encompassing the row containing column labels and potentially additional rows with key information. Unlike the scrollable body of the grid, these headers remain anchored to the viewport, acting as a persistent reference point while users navigate through the data, thus improving user experience.
Several React grids support fixed headers including:
For an in-depth analysis of features and price, visit our React grids comparison.
Tel: (888) 850 9911
Fax: +1 770 250 6199


