


Proveedor oficial
Como distribuidores oficiales y autorizados, le suministramos licencias legítimas directamente de más de 200 editores de software.
Ver todas nuestras marcas.
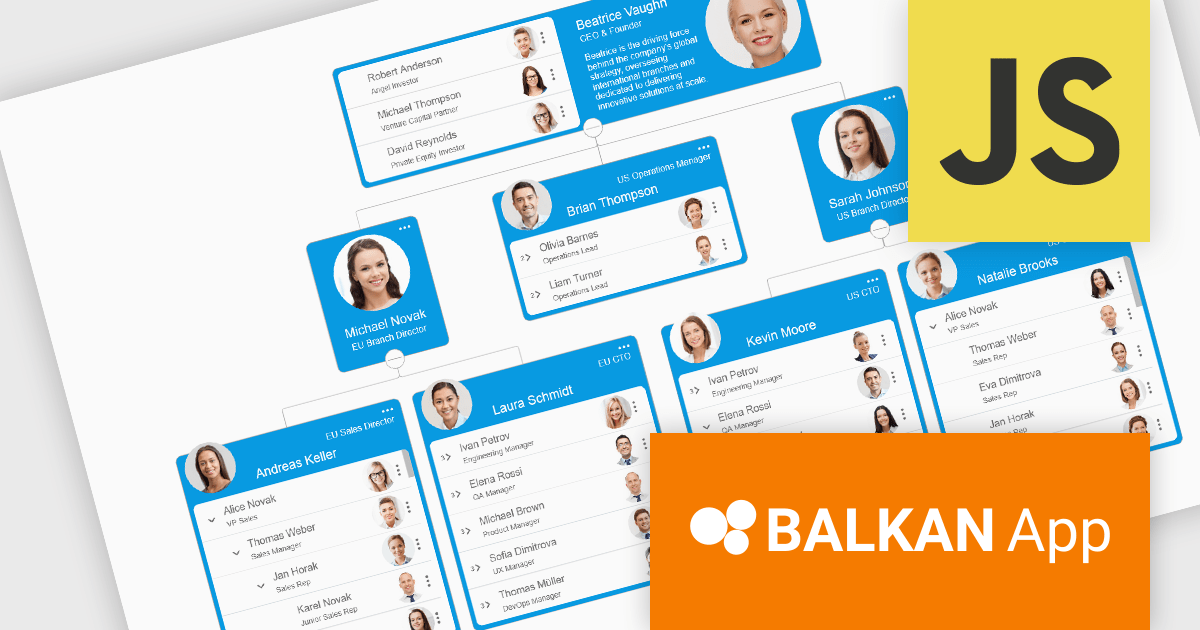
OrgChart JS by BALKAN App is a JavaScript library designed for creating flexible, interactive and customizable organizational charts for presenting structural data. This visual tool helps managers illustrate the roles and hierarchy of an organization, supporting a variety of features, including grouping, assistant nodes, expand/collapse, a built-in search field, and multi-format exports for example to PDF, PNG, SVG or CSV. Compatible with all modern browsers, it supports thousands of nodes without any impact on performance, and offers extensive customization, giving users a versatile and efficient tool for visualizing hierarchical data structures in web applications.
OrgChart JS includes the Tree List Layout, offering a space-efficient and readable way to represent hierarchical data by combining a tree structure with a linear list, enabling developers to display deeply nested hierarchies without the horizontal sprawl of traditional node-link diagrams. It allows nodes to be expanded and collapsed within a vertically aligned list, improving navigation and scalability while maintaining parent-child relationships, and supporting extensive nesting without compromising usability. This makes it particularly useful in scenarios with limited screen space or large datasets, where reducing visual complexity while preserving the full hierarchy is essential, such as administrative dashboards and data management interfaces.
OrgChart JS is licensed based on usage, offering single website, unlimited websites or SaaS, and OEM licenses. It is available as a perpetual license with 1 year maintenance and technical support. See our OrgChart JS licensing page for full details.
For more information, see our OrgChart JS product page.
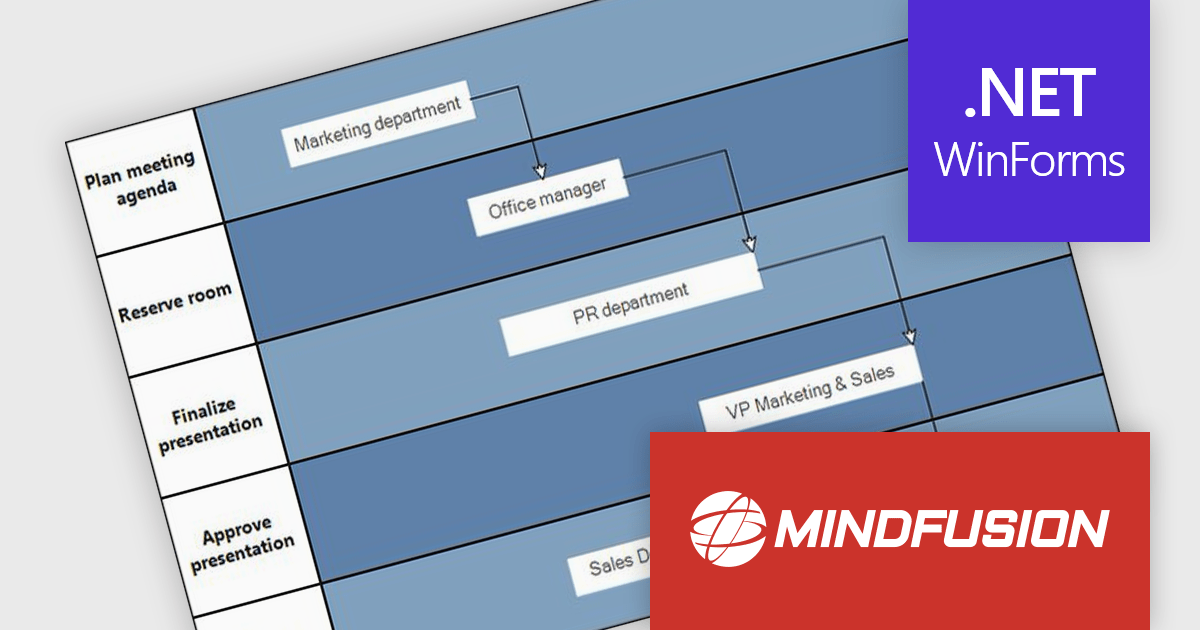
MindFusion.Diagramming for WinForms is a versatile diagramming component that enables developers to create and present workflows, process diagrams, database models, organizational charts, and more. It includes over 100 predefined node shapes, flexible table objects with unlimited rows and columns, and container nodes that can be nested to represent complex structures. With customizable links and arrowhead styles, it helps build clear and interactive visualizations, making it easier to organize information, communicate ideas, and support a wide range of business and technical applications.
The MindFusion.Diagramming for WinForms 7.2 update introduces the new Palette control, providing developers with a structured way to organize and present diagram elements within categorized, collapsible panels. This feature improves usability by enabling efficient navigation and selection of items, particularly in applications with large or complex sets of diagrams. With flexible APIs for adding categories and items programmatically or through collections, the Palette control improves development while supporting scalable user interfaces for diagram-driven applications.
To see a full list of what’s new in version 7.2, see our release notes.
MindFusion.Diagramming for WinForms is licensed per developer, per site, or across an entire enterprise with perpetual licensing. All options include royalty free distribution with no additional runtime or end user fees. See our MindFusion.Diagramming for WinForms licensing page for full details.
For more information, visit our MindFusion.Diagramming for WinForms product page.
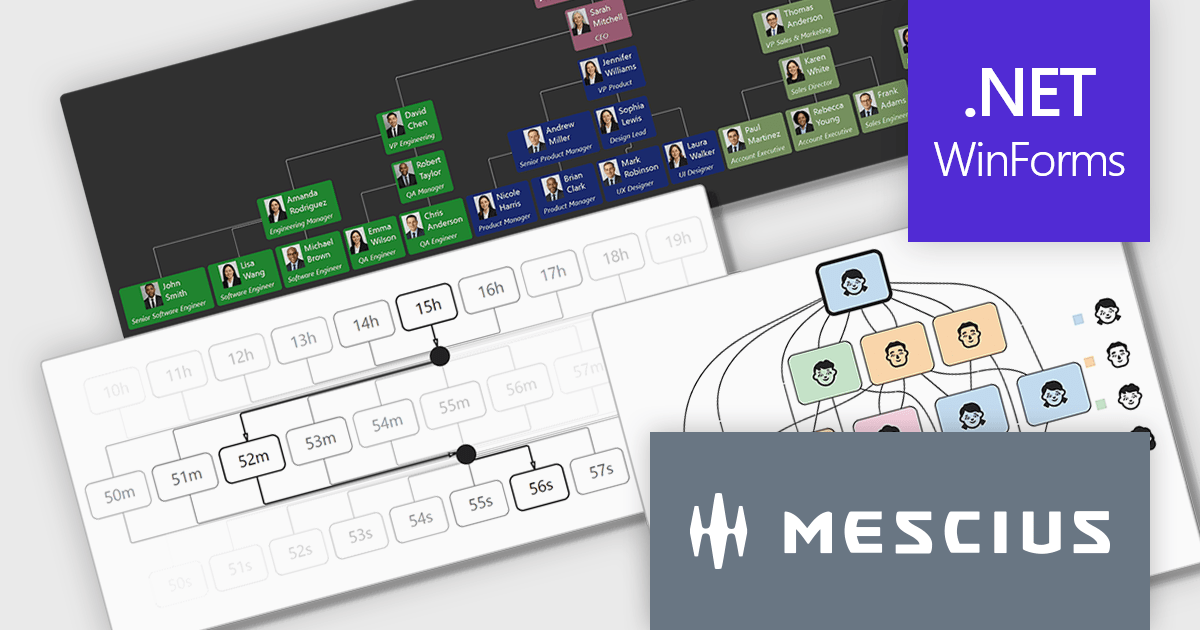
ComponentOne WinForms Edition is a collection of easy-to-use WinForms components that provides access to all updates released within your 1 year subscription period and online support. ComponentOne Winforms Edition includes FlexGrid, FlexChart, FlexReport, InputPanel, Ribbon, DockingTab, and more.
On Wednesday, April 8th at 11:00 AM EDT, MESCIUS is presenting a CodeClinic Live Webinar effecting a deep dive into how .NET developers can convert hierarchical and rule-based datasets into interactive visual diagrams in a Windows Forms application using ComponentOne FlexDiagram. MESCIUS Product Manager Greg Lutz will show you how to bind structured application data to diagram elements, define node relationships, and dynamically generate diagrams using C#. Key takeaways include:
Register for the Live Webinar today and mark your calendar for April 8th.
ComponentOne Studio WinForms is licensed per developer and is available as either a Perpetual or Annual license, depending upon geographic location. Priority Support is also available. See our ComponentOne Studio WinForms licensing page for full details.
Learn more on our ComponentOne Studio WinForms product page.
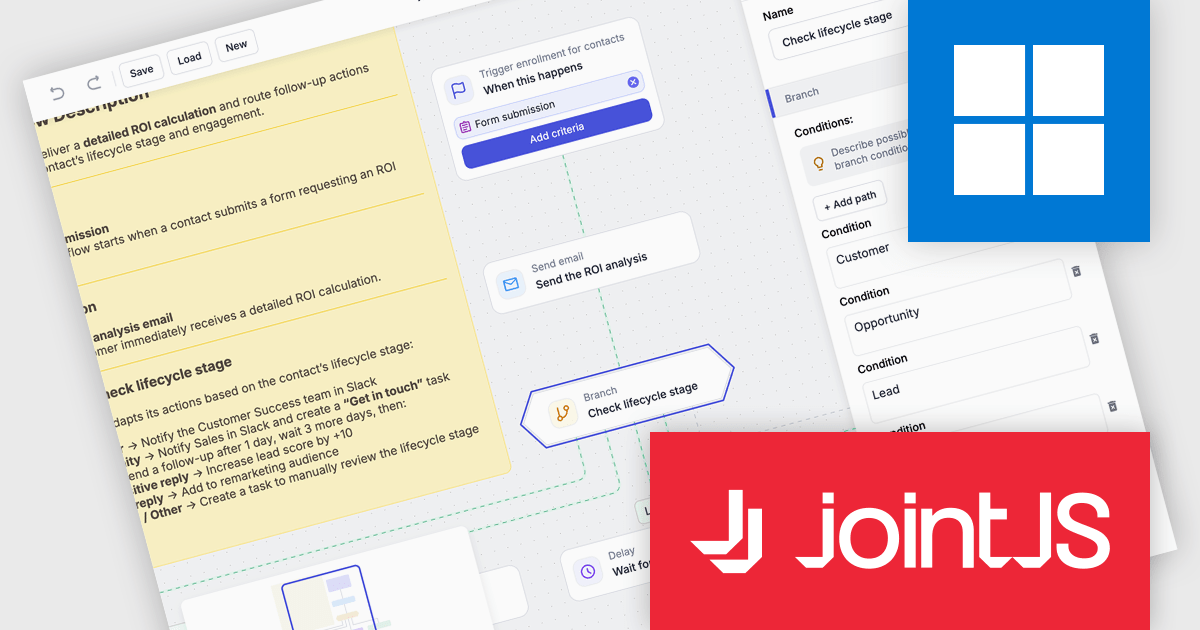
JointJS+ is a diagramming library that offers advanced features like custom shapes, data binding, and advanced layout algorithms, enabling you to create complex, interactive, and visually appealing diagrams. It includes a ready-to-use demo application that showcases its functionality and serves as a starting point for your own diagramming projects.
The JointJS+ v4.2.2 update introduces a new Marketing Automation application template that enables developers to efficiently design, visualize, and manage marketing automation workflows through an interactive, fully animated diagram with automatic layout and orthogonal link routing. By eliminating the need for manual positioning and providing smooth transitions between states, the template improves diagram clarity and maintainability while allowing developers to simulate workflows using the built-in test flow functionality to validate logic, identify issues early, and iterate with greater confidence.
To see a full list of what's new in v4.2.2, see our release notes.
JointJS+ is licensed per developer and is available as a Perpetual license with 1 year support and maintenance. See our JointJS+ licensing page for full details.
Learn more on our JointJS+ product page.
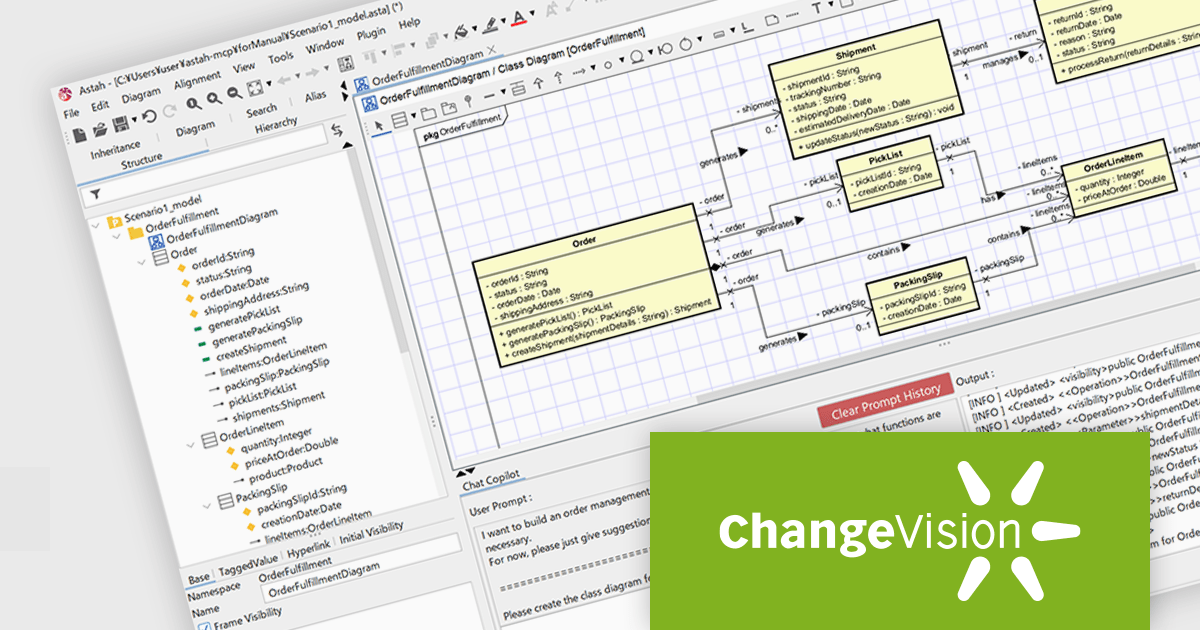
Astah Professional is a powerful diagramming and modeling solution that caters to a wide range of users, from students to enterprise teams. It allows users to create visual representations of ideas and software designs, including UML diagrams, mind maps, and flowcharts. Astah Professional goes beyond simple diagramming by enabling model conversion and relationship management, facilitating clear communication and traceability within your projects.
The Astah Professional v11.0 release introduces powerful AI-assisted modeling features that transform how users design and understand systems. With AI Chat Copilot, you can interact with your model using natural language inside Astah, getting design suggestions and help while editing diagrams. The new MCP Server lets external AI tools connect to Astah models, enabling custom AI integrations and using external documents in modeling workflows. AI Code Reverse enhances reverse engineering by using AI to convert source code into Class and Sequence diagrams, supporting multiple languages and speeding up implementation analysis. These features help model faster, improve quality, and bridge design with implementation.
To see a full list of what's new in v11, see our release notes.
Astah offers numerous licensing options for individuals and organizations. Perpetual licenses provide permanent access with an initial year of support and upgrades. Annual licenses grant access and support for one year, with options for individuals, small teams, and large organizations (with floating licenses). Educational institutions can purchase licenses for individual students or entire faculties. See our Astah Professional licensing page for full details.
Learn more on our Astah Professional product page.
Tel: (888) 850 9911
Fax: +1 770 250 6199


