


Proveedor oficial
Como distribuidores oficiales y autorizados, le suministramos licencias legítimas directamente de más de 200 editores de software.
Ver todas nuestras marcas.
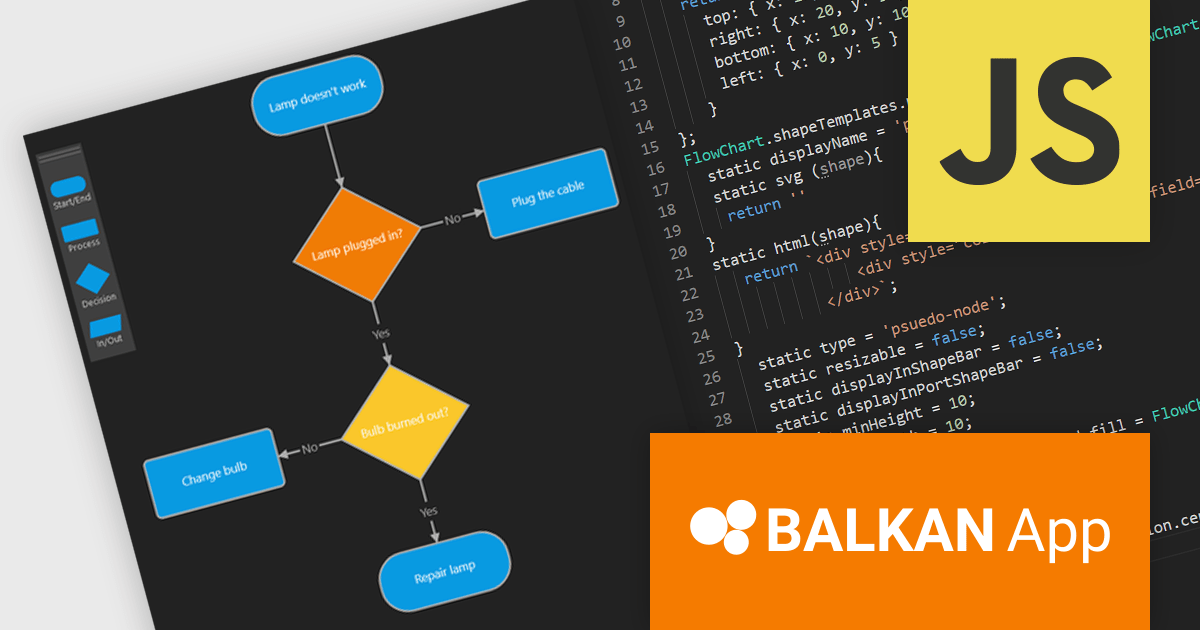
FlowChart JS, a powerful new JavaScript library from BALKAN App, the creators of OrgChart JS, is designed to streamline the creation of interactive and customizable flowcharts. It seamlessly integrates with React, Angular, and Vue.js, offering an intuitive drag-and-drop interface and real-time visual editing, making it easy to visualize complex processes and systems. The library provides a rich set of pre-built shapes and nodes, with the flexibility to create custom shapes, advanced connection and routing options, and a robust API. Its seamless integration into existing applications simplifies the development of clear, structured visualizations.
This new product streamlines the flowchart creation process and enhances visual communication, enabling users to quickly assemble intricate diagrams without extensive coding knowledge. The library's flexibility makes it suitable for a wide range of use cases including business process modeling, software development, educational materials, and technical documentation. By transforming complex information into visually appealing and understandable diagrams, FlowChart JS improves collaboration, decision-making, and problem-solving, providing JavaScript applications with powerful data visualization capabilities.
FlowChart JS is licensed on a perpetual basis with 1 year support and maintenance. Single website, unlimited websites or SaaS, and OEM licenses are available. See our FlowChart JS licensing page for full details.
For more information, see our FlowChart JS product page.
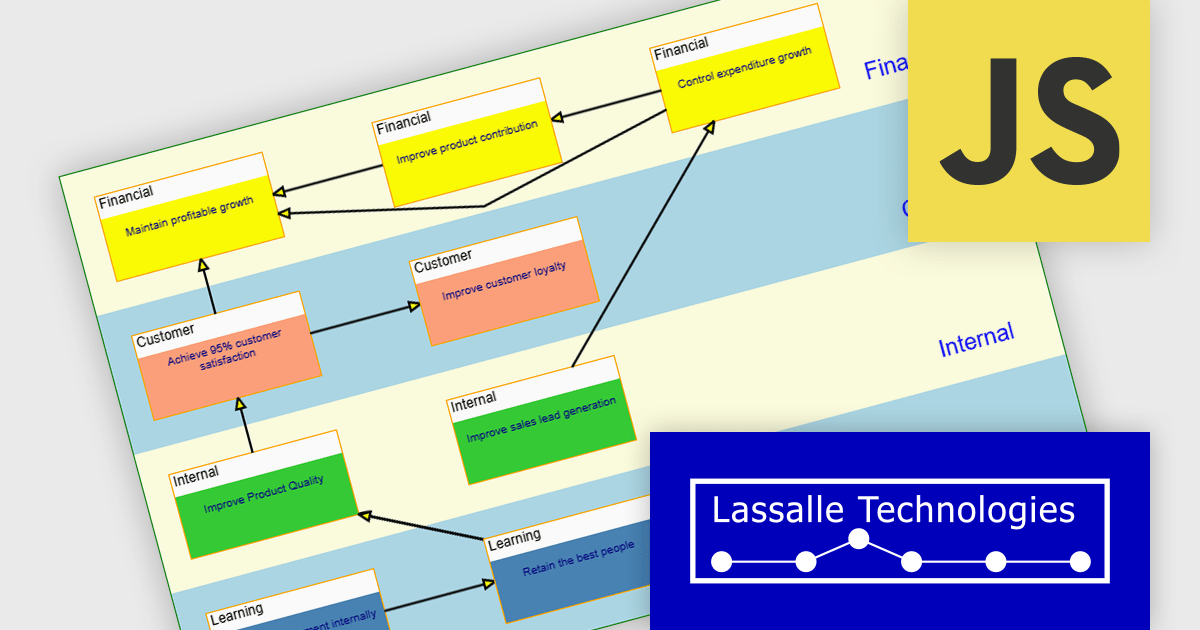
AddFlow Script by Lassalle Technologies is a web-based diagramming component designed for web developers. It empowers users to create interactive flowcharts directly within JavaScript or TypeScript applications. This versatile component allows for the programmatic or interactive generation of two-dimensional diagrams which consist of connected nodes and links.
Primary benefits of AddFlow Script include its ease of use and comprehensive customization options. Due to its lightweight design and royalty-free runtime distribution, developers can seamlessly integrate this flowchart functionality into their web applications. This allows developers to creating a wide range of visualizations, including workflow diagrams, database structures, communication networks, and even quality control charts. Essentially, any process or system that can be broken down into steps and connections can be effectively represented using AddFlow Script.
AddFlow Script is licensed per developer and is runtime royalty free. Site and Enterprise License options are also available. See our AddFlow Script licensing page for full details.
Learn more on our AddFlow Script product page.
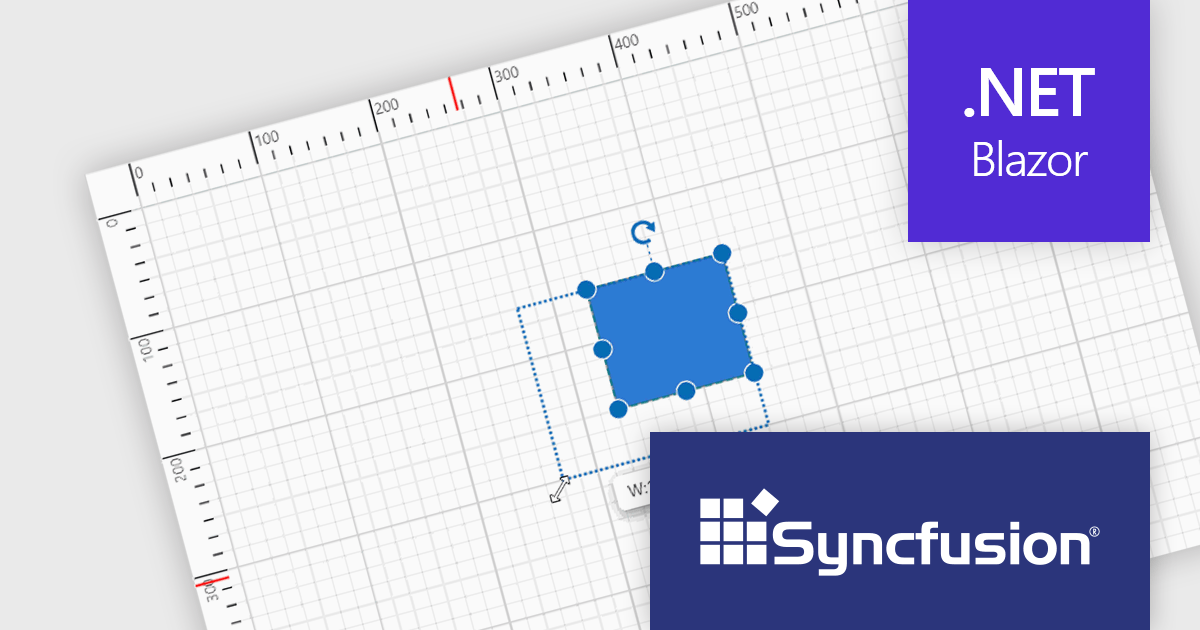
Syncfusion Essential Studio Blazor (available as part of Syncfusion Essential Studio Enterprise) is a comprehensive UI component library designed to accelerate the development of high-performance, modern web applications using the Blazor framework. It boasts over 85+ responsive, lightweight, and modular components spanning various categories such as data visualization, data editing, document processing, and interactive UI elements. This rich repertoire empowers developers to rapidly build user-friendly, feature-rich web interfaces, with seamless integration of both server-side and client-side Blazor applications.
The Syncfusion Essential Studio Blazor 2024 Volume 2 (26.1.35) release introduces a ruler for the Diagram component, enhancing precision and simplifying element arrangement. This ruler provides both horizontal and vertical guides, allowing for visual measurement of object dimensions, indication of element positions, and alignment of various components. This significantly streamlines the creation of accurate and well-proportioned diagrams, particularly for tasks like crafting scale models.
To see a full list of what's new in 2024 Volume 2 (26.1.35), see our release notes.
Syncfusion Essential Studio Blazor is available as part of Syncfusion Essential Studio Enterprise which is licensed per developer starting with a Team License of up to five developers. It is available as a 12 Month Timed Subscription License which includes support and maintenance. See our Syncfusion Essential Studio Enterprise licensing page for full details.
Learn more on our Syncfusion Essential Studio Blazor product page.
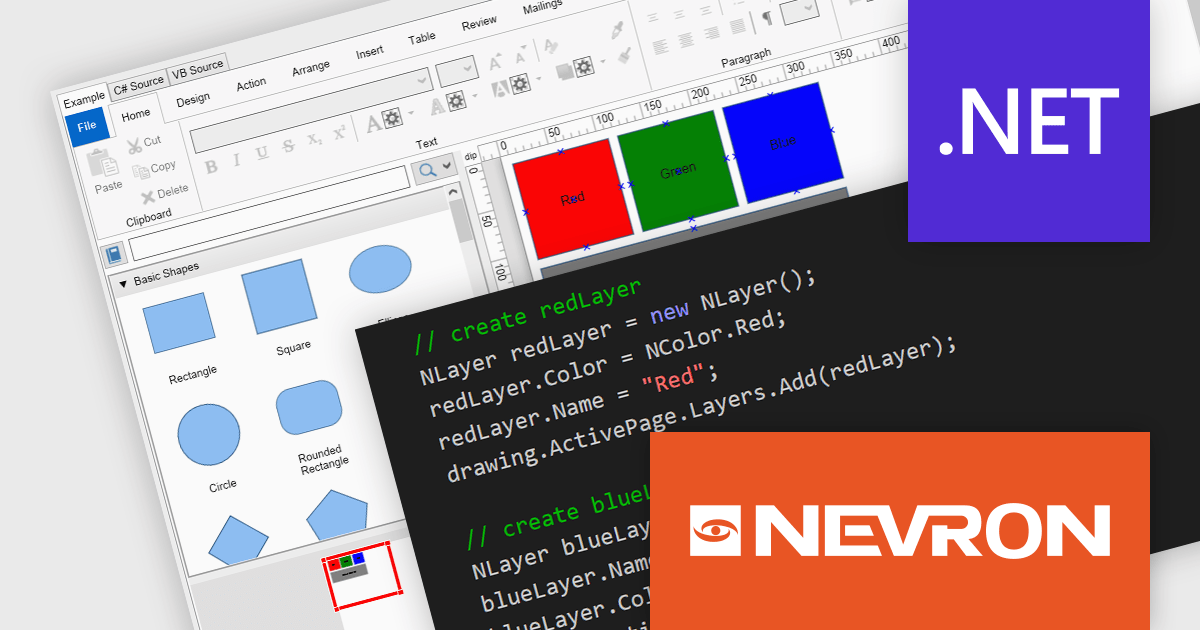
NOV Diagram for .NET by Nevron is a comprehensive and feature-rich diagramming framework designed for .NET developers to create specialized diagramming and drawing applications. Including most of the functionality found in Microsoft Visio, it offers an array of features such as high-performance rendering, a rich set of predefined shapes, automatic layout algorithms, and extensive input/output capabilities. This tool facilitates the integration of complex visualizations directly into WinForms, WPF, Blazor, and Xamarin.Mac projects for developing sophisticated diagramming solutions while maintaining responsiveness and user interactivity.
The NOV Diagram for .NET 2024.1 update introduces a new layers feature which gives developers greater control over complex diagram designs. Enabling the segregation of different visual components into distinct layers allows for better organization, making it easier to manage intricate diagrams that require multiple overlapping elements. This functionality means that each page item can now be assigned to a layer, which can be independently manipulated, hidden, or locked without affecting others. This provides a more streamlined workflow and reduces the likelihood of errors during both development and runtime.
To see a full list of what's new in 2024.1, see our release notes.
NOV Diagram for .NET is licensed per developer and is available as a perpetual license with 1 year support and maintenance. See our NOV Diagram for .NET licensing page for full details.
NOV Diagram for .NET is available in the following products:
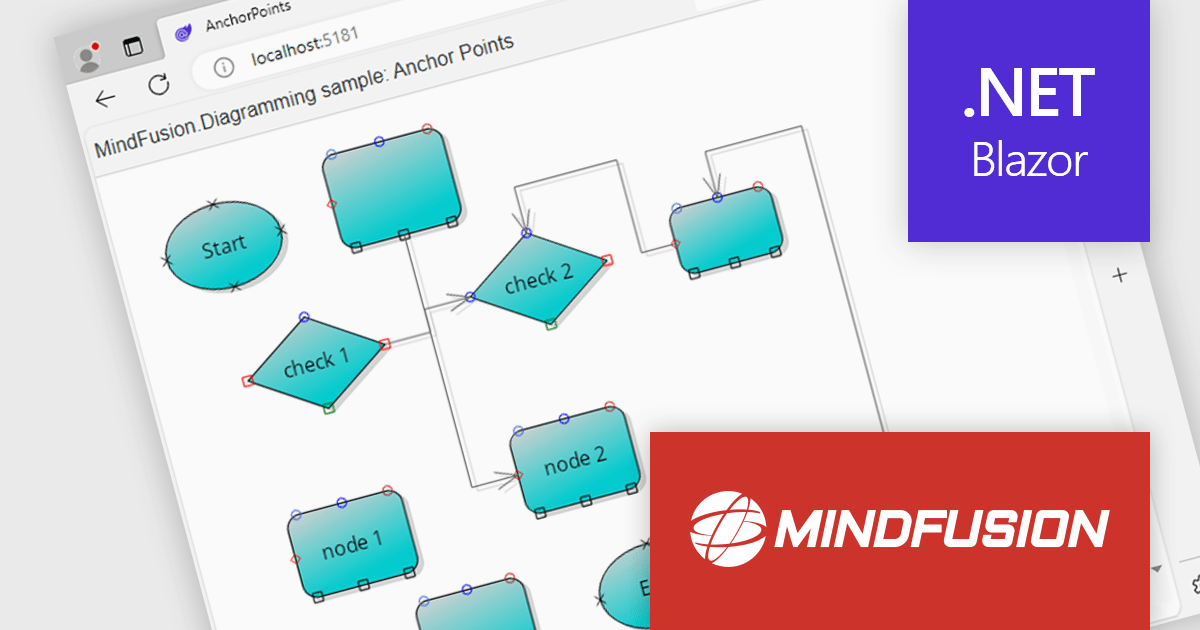
MindFusion.Diagramming for Blazor is a commercial library that empowers you to add interactive diagramming functionalities to your Blazor web applications. It leverages the power of Blazor to seamlessly integrate MindFusion's well-established diagramming capabilities, offering a rich set of features for crafting numerous visual representations.
MindFusion.Diagramming for Blazor empowers you to create a variety of diagrams, including process maps, network architectures, mind maps, and organizational charts. This translates to broader application in fields like project management, software development, and any scenario where visual communication of ideas or data structures is beneficial.
MindFusion.Diagramming for Blazor is licensed per developer and is available as a perpetual license with 1 year subscription and support. See our MindFusion.Diagramming for Blazor licensing page for full details.
MindFusion.Diagramming for Blazor is available in the following products:
Tel: (888) 850 9911
Fax: +1 770 250 6199


