













Proveedor oficial
Como distribuidores oficiales y autorizados, le suministramos licencias legítimas directamente de más de 200 editores de software.
Ver todas nuestras marcas.
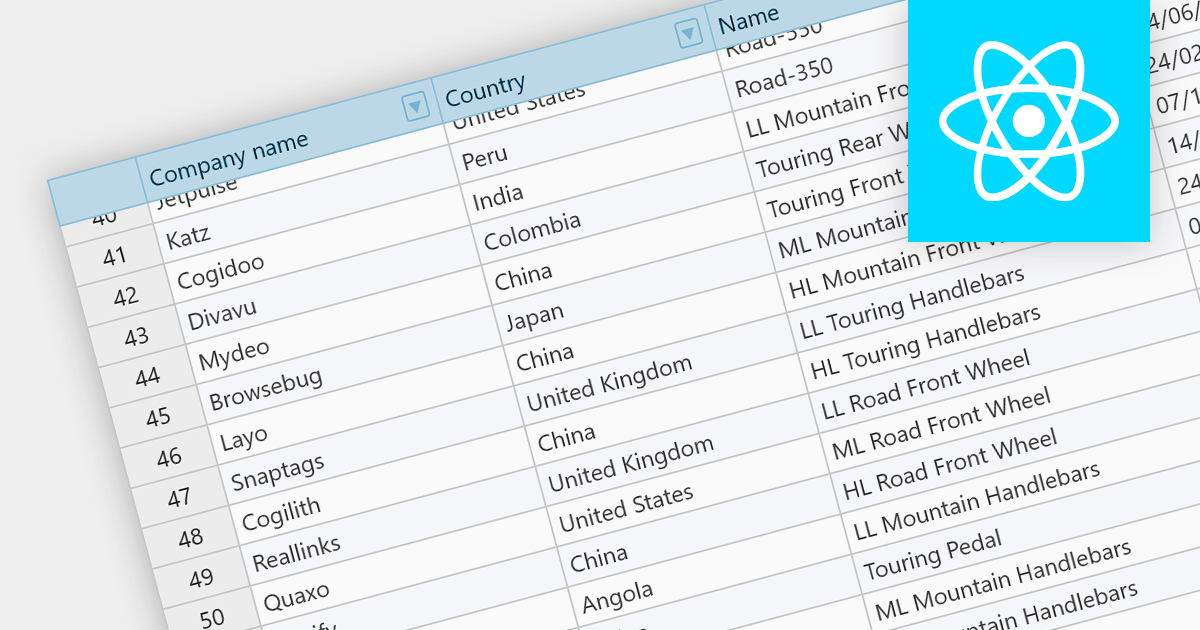
Fixed headers are a user interface element found in grids, particularly those managing large datasets. They comprise the top section of the grid, typically encompassing the row containing column labels and potentially additional rows with key information. Unlike the scrollable body of the grid, these headers remain anchored to the viewport, acting as a persistent reference point while users navigate through the data, thus improving user experience.
Several React grids support fixed headers including:
For an in-depth analysis of features and price, visit our React grids comparison.
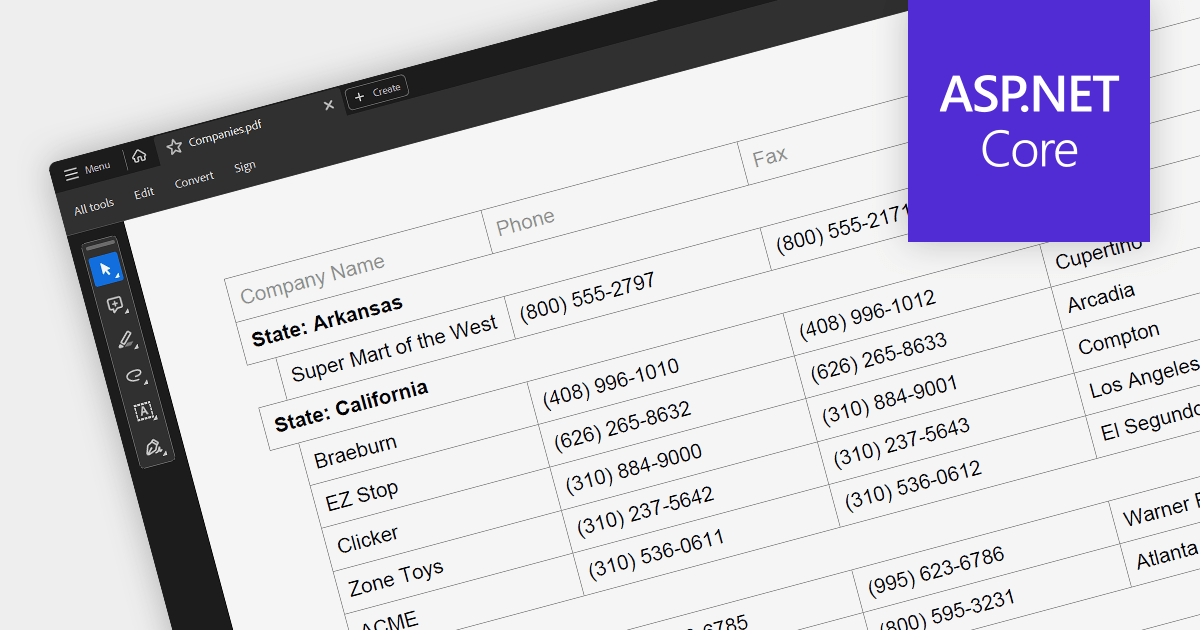
PDF export is a powerful feature in grid controls, allowing users to capture and share data presented in a readily accessible format. This functionality typically involves dedicated methods or settings within the grid, enabling seamless transformation of the displayed data into a structured PDF document. Users often have control over what sections and columns to export, along with formatting options like headers, fonts, and page layout. This flexibility makes PDF export ideal for generating printable reports, archiving snapshots of grid data, and distributing information beyond the confines of the application.
Several ASP.NET Core grids support exporting to PDF including:
For an in-depth analysis of features and price, visit our ASP.NET Core grids comparison.

DevExpress WinForms is a comprehensive suite of 190+ UI controls and development tools designed for building high-performance desktop applications. It offers a broad array of customizable controls, from data grids and ribbon interfaces to advanced charts, maps, and diagramming components. This empowers developers to rapidly create functionally rich applications, while adhering to accessibility guidelines and touch-enabled technology for modern Windows environments.
The DevExpress WinForms 23.2 release adds accessible keyboard navigation support to several controls, including the Ribbon, Backstage View, Recent Control, Data Grid, TreeList, CardView, Breadcrumb Editor, and Expression Editor. Users can navigate using arrow keys, keyboard shortcuts, and the Enter and Escape keys.
To see a full list of what's new in version 23.2, see our release notes.
DevExpress WinForms is licensed per developer and is available as a Perpetual License with a 12 month support and maintenance subscription. See our DevExpress WinForms licensing page for full details.
DevExpress WinForms is available to buy in the following products:
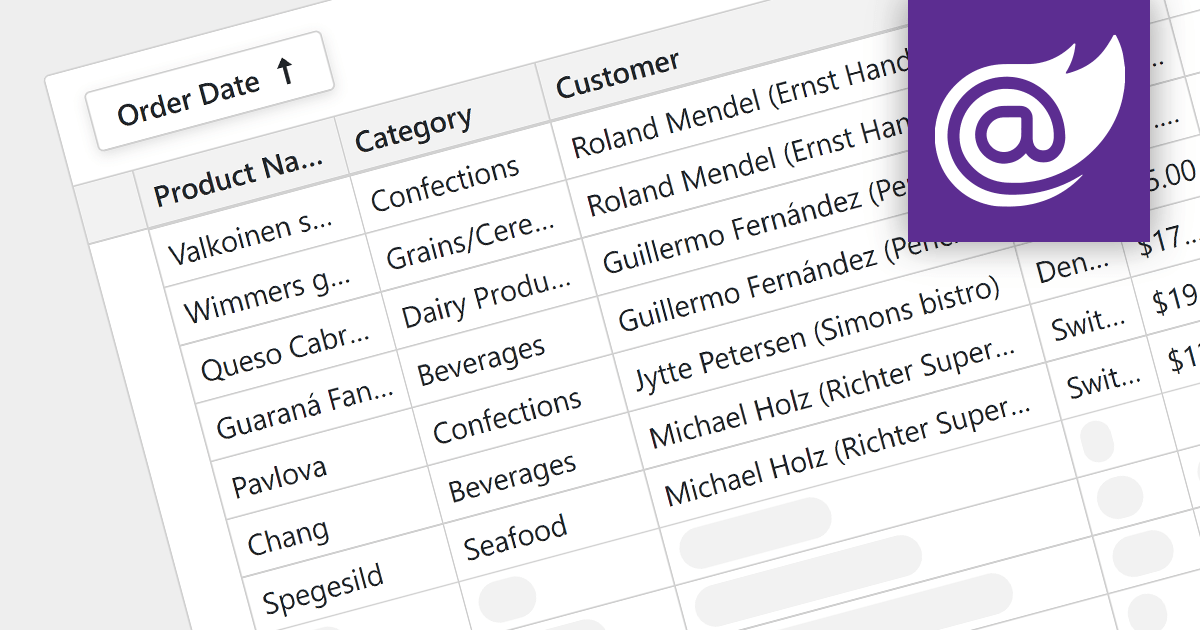
For large datasets, traditional grid scrolling struggles to maintain performance, often becoming sluggish and resource-intensive. Virtual scrolling provides a more efficient alternative. Instead of rendering the entire dataset at once, it dynamically fetches and displays only the visible rows, keeping the rest cached and unloaded. This significantly reduces the number of elements in the application, resulting in a noticeably smoother scrolling experience, even with millions of data points. Virtual scrolling empowers users to seamlessly explore expansive datasets without compromising performance or responsiveness.
Several Blazor grid components support virtual scrolling including:
For an in-depth analysis of features and price, visit our Blazor grids comparison.
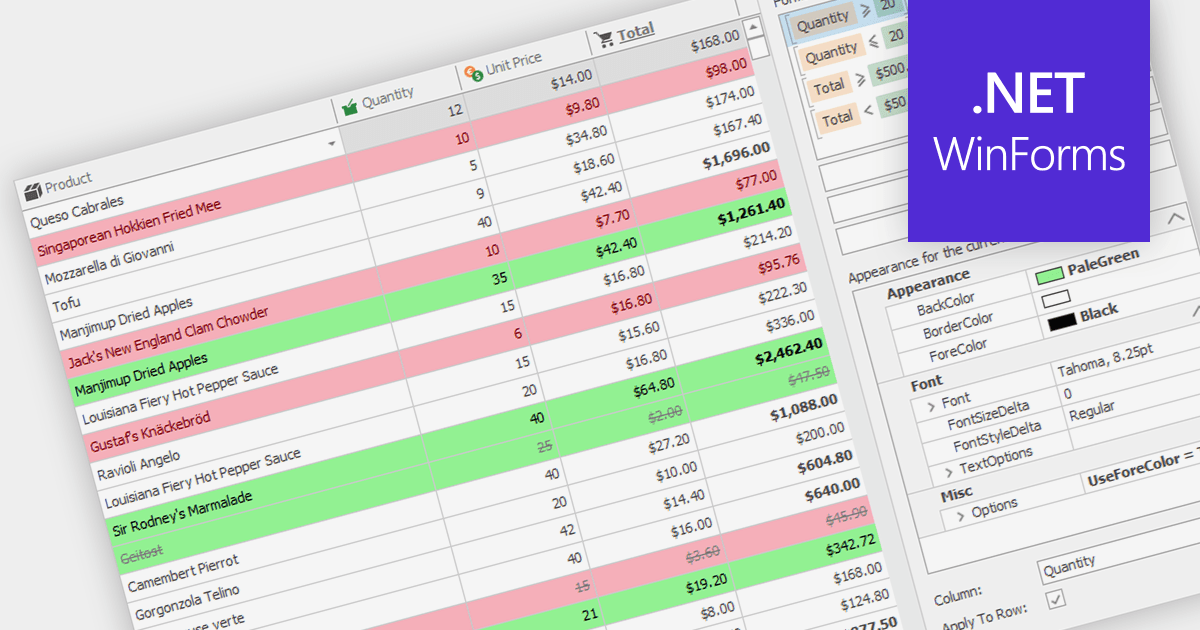
Conditional formatting in grids allows users to apply visual styles to cells or ranges based on the data they contain. It enhances data readability and analysis by highlighting critical values, outliers, or trends in a data-driven manner. For instance, a cell might be colored red if it contains a value below a certain threshold, thereby drawing attention to potential issues.
Several WinForms grid components support conditional formatting including:
For an in-depth analysis of features and price, visit our WinForms Grid comparison.
Tel: (888) 850 9911
Fax: +1 770 250 6199


