


Proveedor oficial
Como distribuidores oficiales y autorizados, le suministramos licencias legítimas directamente de más de 200 editores de software.
Ver todas nuestras marcas.
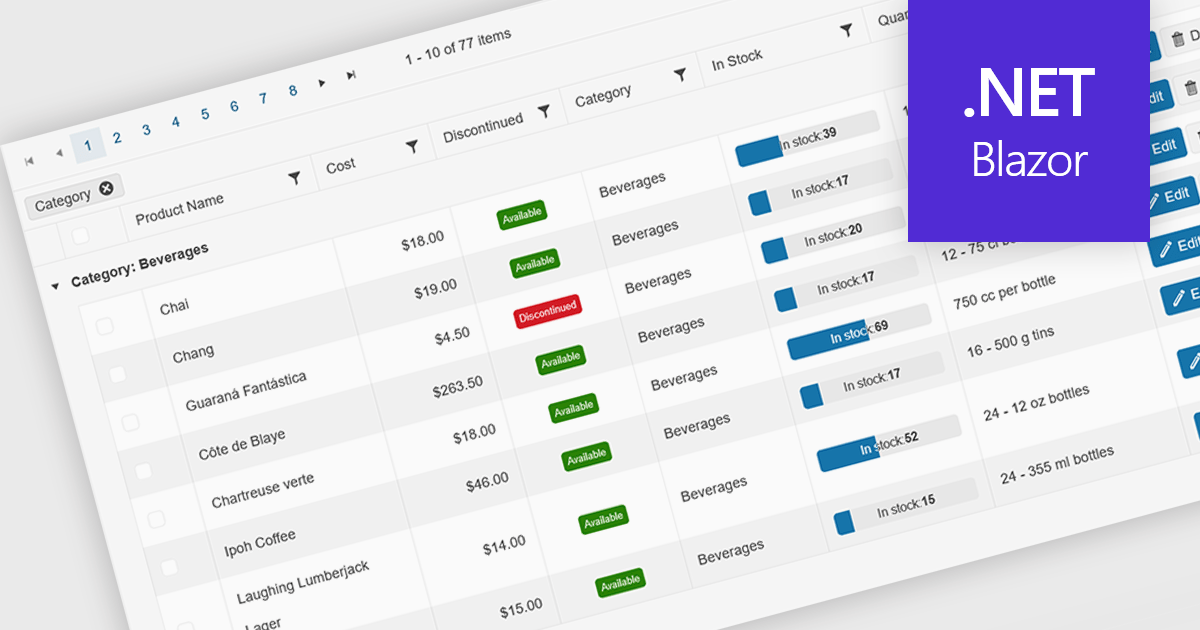
Grid paging is a user interface technique that divides large datasets into smaller, manageable pages within a grid or table. This significantly enhances performance by reducing the amount of data processed and displayed at once, improving load times and responsiveness, particularly when dealing with extensive datasets. Paging also enhances user experience by providing a clear structure for navigating through information, helping to prevent the user from being overwhelmed with excessive data.
Several Blazor grid controls offer paging support including:
For an in-depth analysis of features and price, visit our Blazor grid controls comparison.
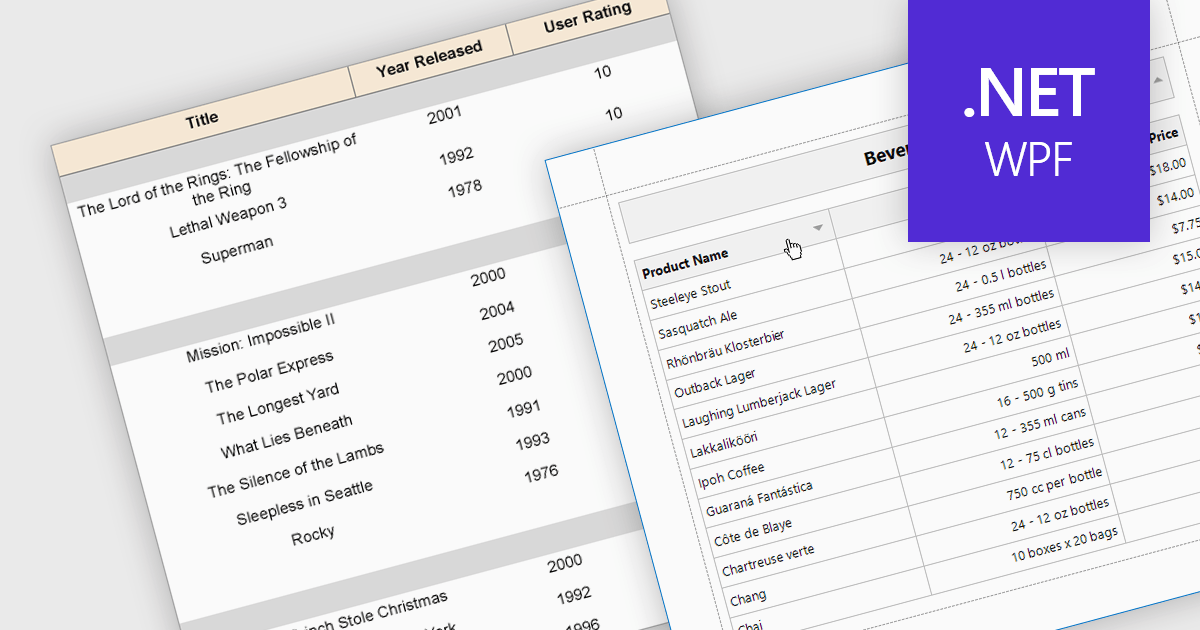
Effective reporting components benefit greatly from robust sorting functionality. This allows users to quickly organize data by any relevant column, facilitating identification of trends, outliers, and specific values. Sorting is particularly valuable for large datasets, enabling users to prioritize high-value information and tailor reports to their specific needs. This improves data exploration efficiency and user satisfaction within the reporting tool.
Several WPF reporting components support data sorting, including:
For an in-depth analysis of features and price, visit our WPF reporting components comparison.
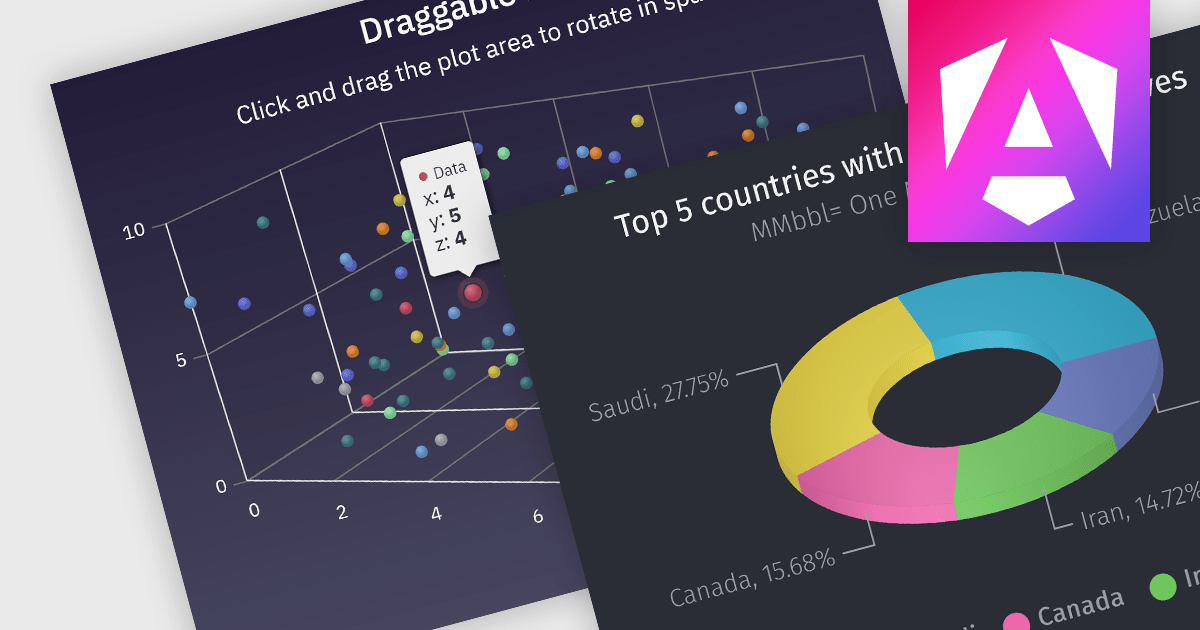
3D charts allow data visualization with depth along a third axis. This capability goes beyond traditional 2D charts, offering a more immersive and informative view. 3D charts are particularly beneficial for complex datasets with multiple variables, as they can reveal patterns and relationships that might be obscured in a flat format. Use cases include showcasing product sales across regions and demographics, visualizing financial trends over time, or depicting scientific data with multiple dimensions.
Several Angular chart controls offer 3D charts including:
For an in-depth analysis of features and price, visit our comparison of Angular chart controls.
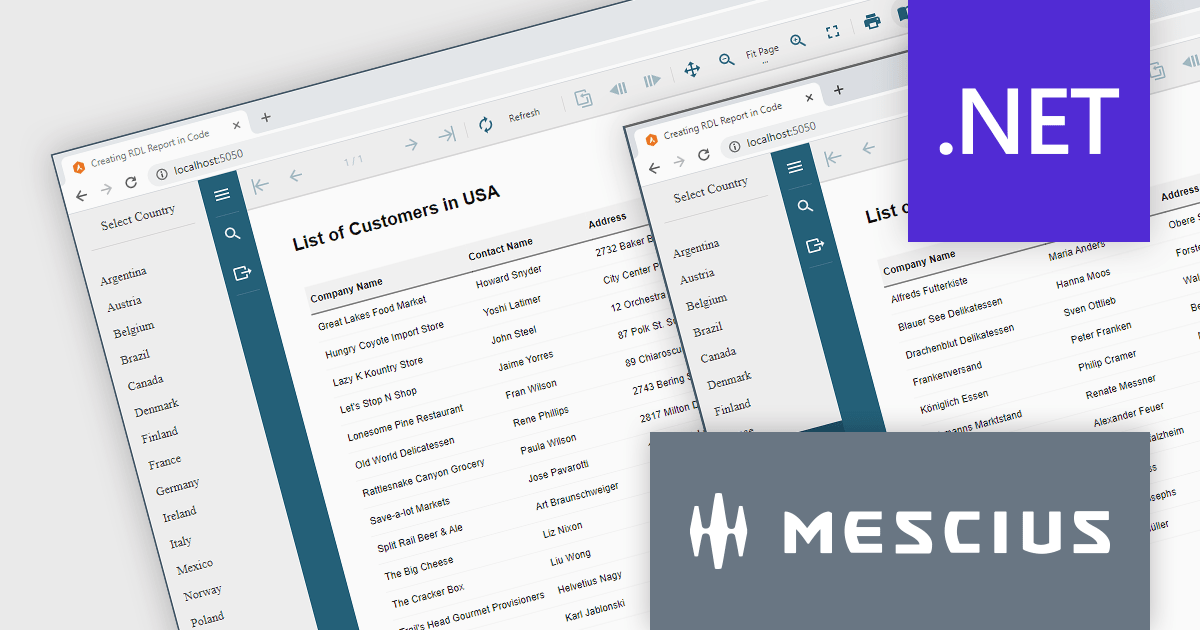
ActiveReports.NET helps you deliver beautiful reports with intuitive Visual Studio integrated report designers and rich controls. It provides code-based cross-platform reporting, easy-to-use designers, and a flexible API. Available for desktop (WinForms, WPF, .NET) and web (JavaScript, Blazor, ASP.NET MVC). Design and deliver powerful reports with intuitive, reliable, and user-friendly report designers and controls. It supports multiple report types, including RDL Reports.
Report Definition Language (RDL) defines a common schema that enables the interchange of report definitions. There are instances where it becomes necessary to programmatically generate an RDL report in your code, manage data binding conditionally at runtime, or modify the layout of a report based on user input. In this blog post, MESCIUS Product Manager Alec Gall guides you through the procedures required for using ActiveReports.NET to create an RDL report exclusively using C# code. Steps include:
Read the complete blog and learn how to leverage this powerful and flexible method for generating dynamic reports using ActiveReports.
ActiveReports.NET is licensed per developer and is available with or without a 12 month support and maintenance subscription. See our ActiveReports.NET licensing page for full details.
Learn more on our ActiveReports.NET product page.
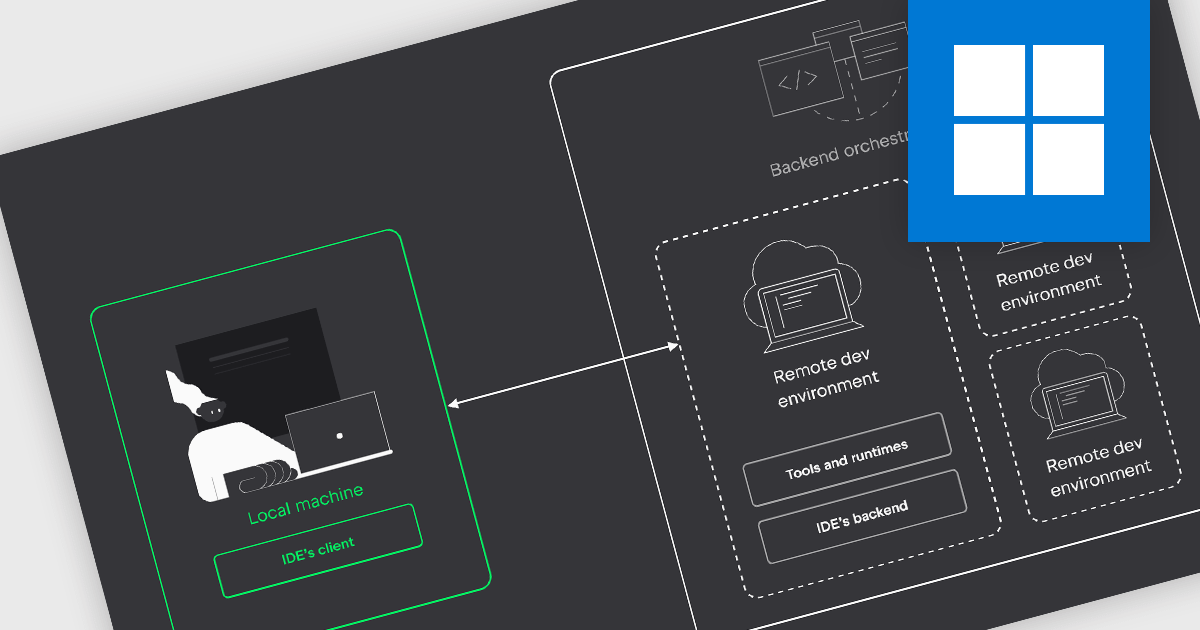
IDEs with remote development capabilities enable developers to utilize a powerful remote machine for coding while enjoying the familiarity and features of their preferred IDE on a local device. This unlocks benefits like building and debugging on robust servers, collaborating on projects in geographically dispersed teams, and working from less powerful machines, all while maintaining a smooth development experience.
Several IDEs offer support for remote development including:
For an in-depth analysis of features and price, visit our IDEs comparison.
Tel: (888) 850 9911
Fax: +1 770 250 6199


