


Proveedor oficial
Como distribuidores oficiales y autorizados, le suministramos licencias legítimas directamente de más de 200 editores de software.
Ver todas nuestras marcas.
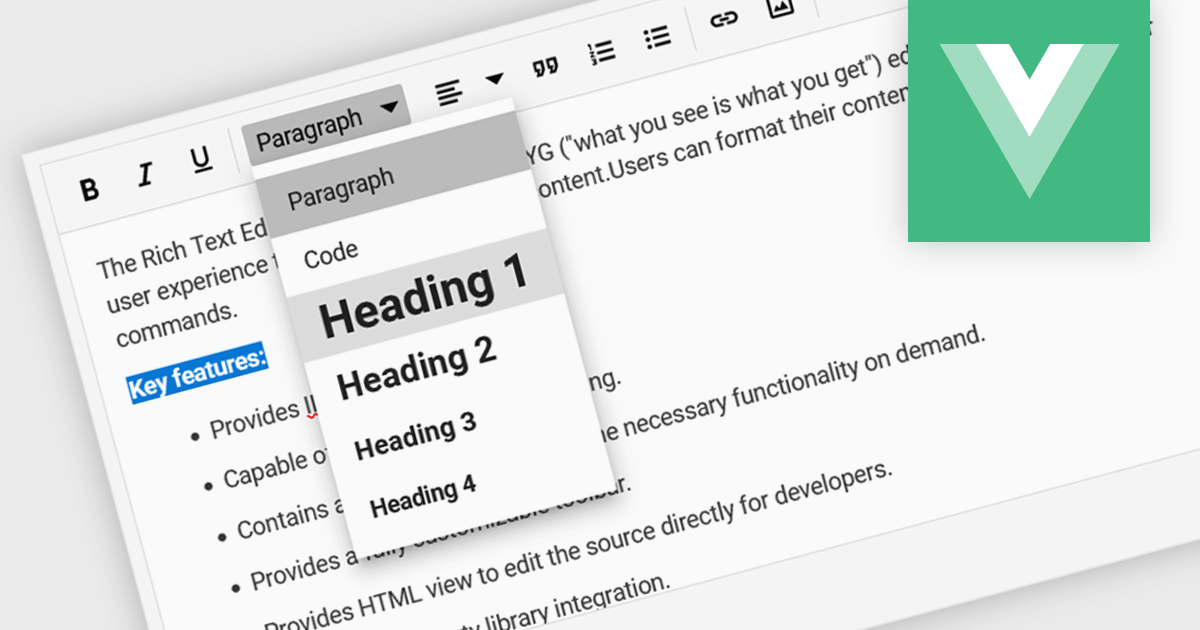
Rich text editor components offer a familiar interface for users to format text, insert images and tables, and create structured content. Benefits include increased user engagement, simplified content creation, and improved accessibility for users with varying technical skills. Common use cases include crafting blog posts, product descriptions, and managing user-generated content within forums and comments sections.
Several Vue.js UI Suites offer rich text functionality, including:
For an in-depth analysis of features and price, visit our comparison of Vue.js UI Suites.
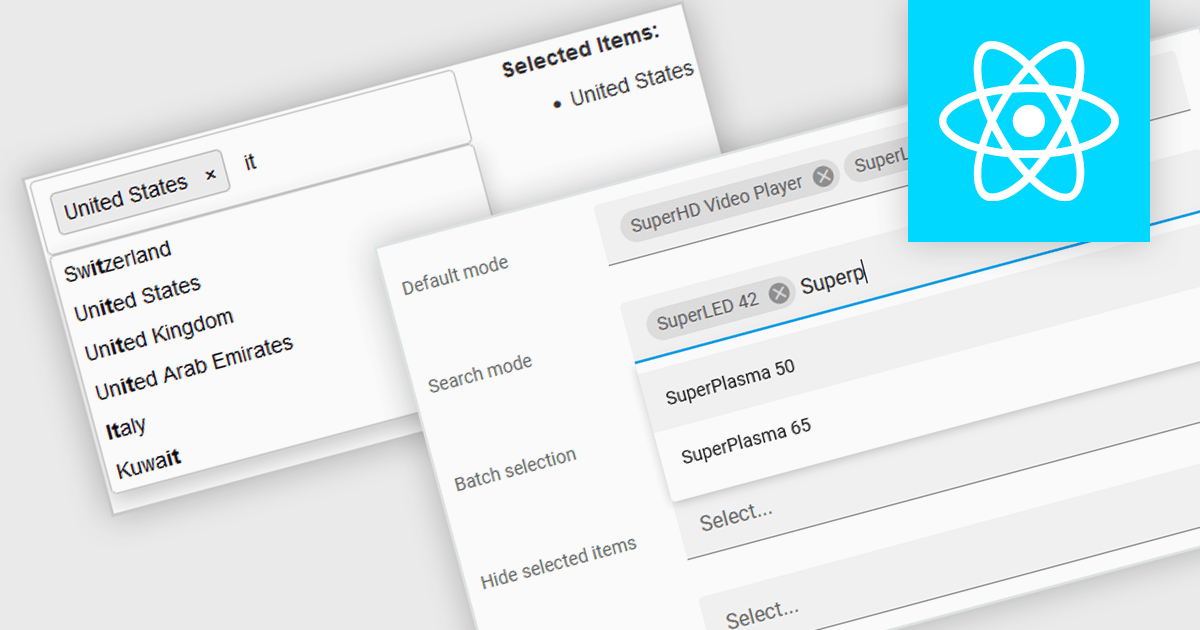
Token boxes, also known as token input controls, are user interface elements designed to streamline data entry for multiple values. They allow users to input, manage, and manipulate discrete pieces of data (tokens) within a single form field. This enhances user experience by facilitating tagging, categorization, and selection of multiple items, while providing developers with a robust tool for intuitive interfaces. The benefits include improved clarity through visual separation of values, efficient data handling, and ease of use in applications like search filters, email address inputs, and tagging systems.
Many React data editor collections contain token box / input controls including:
For an in-depth analysis of features and price, visit our comparison of React Data Editors.
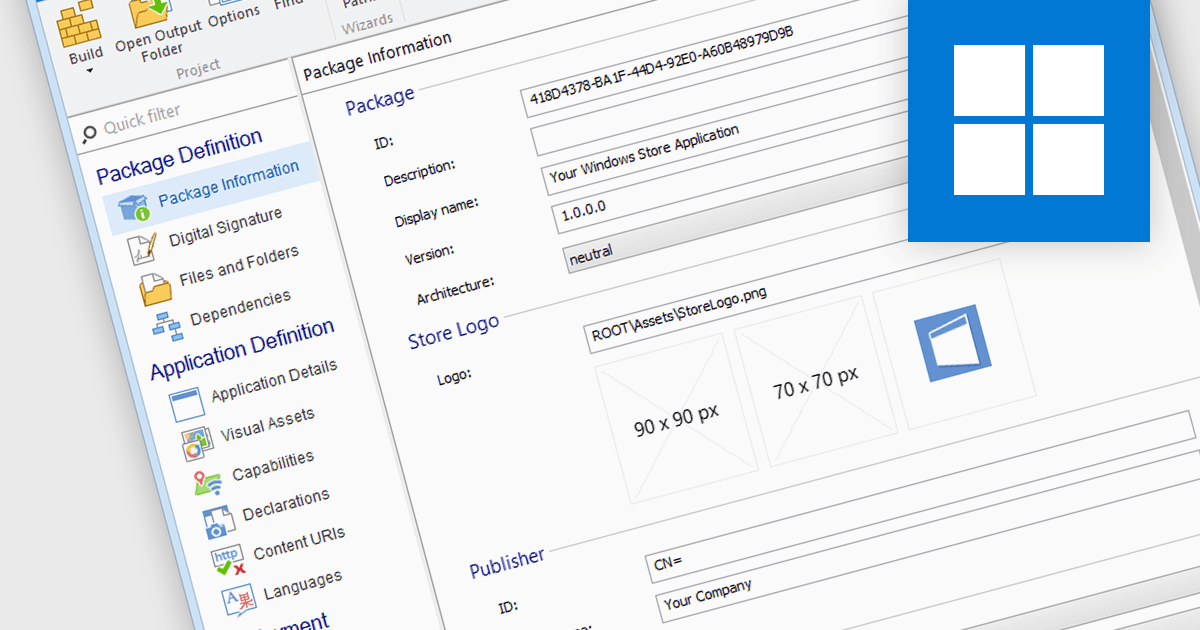
Microsoft Store Apps, also known as Universal Windows Platform (UWP) apps, use a special development framework to enable distribution via the Microsoft Store (formerly known as the Windows Store). This simplifies the installation procedure for end users, eliminates the need for manual setup scripts, and ensures compatibility with a variety of Windows devices. Software developers who use the UWP strategy benefit from a centralized distribution channel, simpler deployment, and a larger potential audience. Using installation tools to package your programs as MSIX or APPX files makes it easier to submit compliant applications to the Microsoft Store.
Several Installation Tools offer packaging for Microsoft Store Apps including:
For an in-depth analysis of features and price, visit our comparison of Installation Tools.
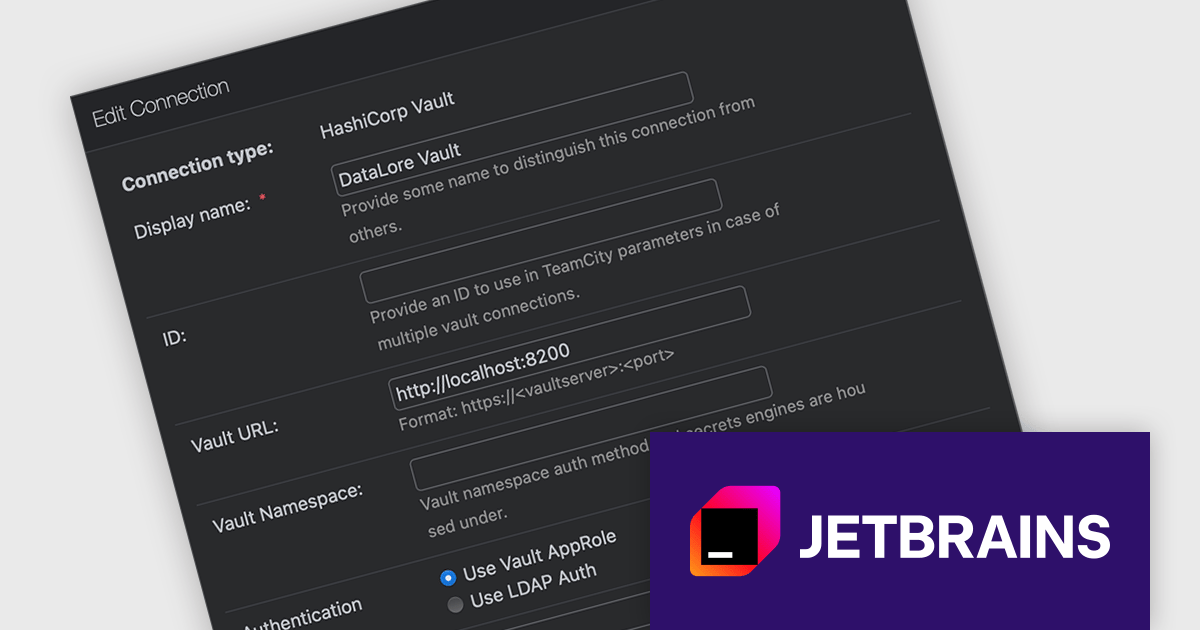
TeamCity Cloud by JetBrains is a hosted continuous integration (CI) platform that eliminates the need for software developers to manage and maintain physical servers for build pipelines. It offers pre-configured build agents or the option to connect your own, facilitating integration with popular build tools and test frameworks. TeamCity Cloud streamlines the CI process by automating builds and tests, optimizing resource allocation, and providing secure artifact storage – all accessible through a user-friendly web interface.
Starting with TeamCity Cloud version 2024.03, the HashiCorp Vault Support plugin is now included as a standard feature, simplifying how you manage sensitive data within your builds. HashiCorp Vault is a secure secrets management tool that centralizes and encrypts sensitive information like API keys, passwords, and certificates. By integrating TeamCity with Vault, you can reference these secrets using TeamCity parameters during the build process without storing them directly in your build scripts or configuration files. This not only enhances security by eliminating sensitive data exposure in your code, but also streamlines secret management for your development teams.
To see a full list of what's new in version 2024.03, see our release notes.
TeamCity Cloud is licensed per Committer, and is available as a commercial annual license. See our TeamCity Cloud licensing page for full details.
For more information, visit our TeamCity Cloud product page.
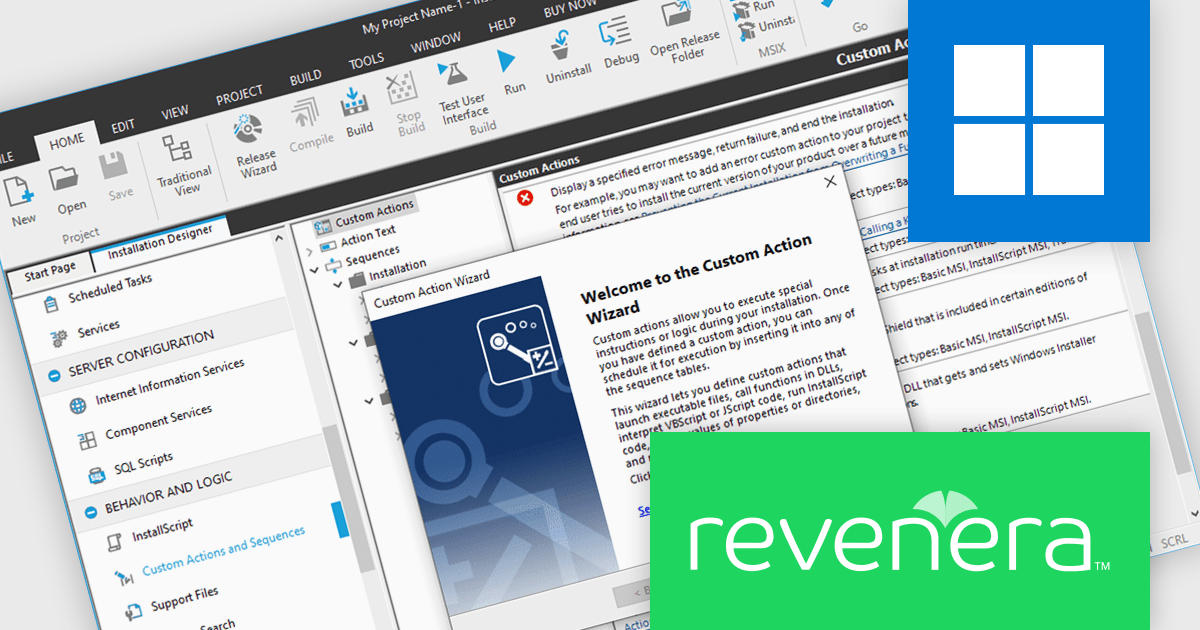
InstallShield by Revenera is a leading Windows installation development solution that specializes in building installers and managing software packages. InstallShield offers a streamlined interface and comprehensive features, enabling developers to efficiently create professional installers, configure prerequisites, manage updates, and customize the installation experience for diverse user needs.
InstallShield 2024 R1 introduces exciting support for .NET Core custom actions. This means you can now leverage the power of .NET Core within your installation workflows. Through the Custom Actions and Sequences view, you can effortlessly add .NET Core custom actions to your project. These actions execute public methods within .NET assemblies written in familiar managed languages like C# or Visual Basic .NET. This new feature grants you more flexibility and control during the installation process, allowing you to seamlessly integrate custom functionalities written in .NET Core.
To see a full list of what's new in version 2024 R1, see our release notes.
InstallShield is licensed per user and is available as a 3 Year Timed Subscription. See our InstallShield Professional licensing page or InstallShield Premier licensing page for full details.
For more information, visit our InstallShield Professional or InstallShield Premier product pages.
Tel: (888) 850 9911
Fax: +1 770 250 6199


