Funcionalidad de ComponentOne Studio WinForms

Visually display data on maps in your reports.
Mapping in Reports
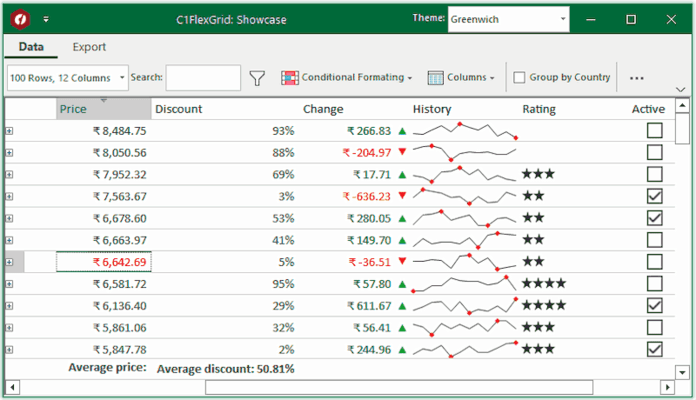
Get great grid performance and features.
Grids
Generate cutting-edge reports for your .NET applications.
All-in-one Reporting
Replicate popular interfaces as seen in Microsoft Office.
Mimic Microsoft UIs
Packed with all the charting functionality you need.
Advanced Charting
Visually display data on maps in your reports.

Visually display data on maps in your reports.

New custom mapping report field enables you to visually display data on maps (using ComponentOne Maps for WPF) in your reports.

Get great grid performance and features.

Get great grid performance and features.

Each is designed to give you the best performance and features for different types of applications. Both grids offer many out-of-the-box features like filtering, hierarchical data-binding, grouping, printing, and exporting to Microsoft Excel without any additional coding required. True DBGrid supports the most common features out of the box (requires little to no coding). FlexGrid's true value lies beyond this list as it’s flexible to do so much more than just what’s considered “out of the box.”

Generate cutting-edge reports for your .NET applications.

Generate cutting-edge reports for your .NET applications.

With a rich object model for generating reports, several UI controls for previewing, and a report designer for creating and designing reports, Reports for WinForms is your all-in-one reporting solution. Generating cutting-edge reports for your .NET applications has never been easier. You can even integrate your existing reporting solutions (SQL Server, Access, Crystal) into your applications.

Replicate popular interfaces as seen in Microsoft Office.

Replicate popular interfaces as seen in Microsoft Office.

Provide a docking UI similar to Visual Studio using DockingTab, create an appointments calendar similar to Outlook with Scheduler, and deliver a complete Office 2010 menu system using Ribbon. These customizable controls can be easily modified to perfectly fit your application.

Packed with all the charting functionality you need.

Packed with all the charting functionality you need.

Over 80 chart types, designers for code-free development and flexible and customizable charting elements.