LightningChart Python

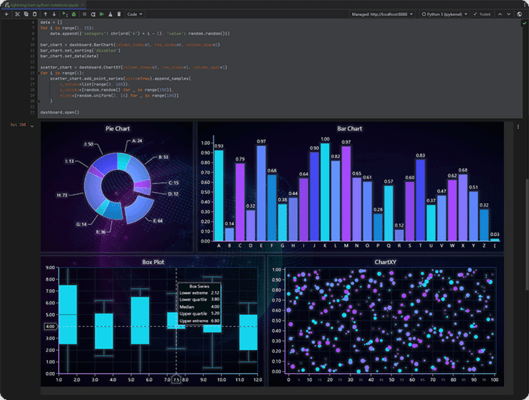
LightningChart Python is a high performing data visualization library for the Python programming language. It allows you to present real-time or static data as fast and interactive 2D or 3D charts. Designed for data scientists and software developers, this GPU-accelerated charting library can handle large static datasets or dynamic real-time streaming data by utilizing graphics processors and WebGL rendering for the smooth visualization of up to millions of data points.

LightningChart Python Features

  • When dealing with massive static datasets or dynamic real-time streaming data, LightningChart Python can be used to turn them into fully interactive and responsive charts with smooth performance.
  • LightningChart Python achieve this by harnessing the raw processing power of graphics processors and leveraging WebGL rendering, enabling the smooth visualization of up to millions of data points.
  • The integration of LightningChart Python assists data scientists...

Últimas novedades

Visualice datos complejos con renderización WebGL
February 27, 2025Product Update
LightningChart Python proporciona visualización en tiempo real acelerada por GPU para paneles dinámicos, simulaciones científicas y análisis financieros.

Precios desde: $ 882.00

The Data Scientist License (Premium Edition) permits the Licensee to install and use the software during the duration of the Subscription Period only. The subscription includes usage rights and...

¿Alguna pregunta?

Chatee en vivo ahora mismo con nuestros especialistas en licencias de LightningChart.

LightningChart
Como distribuidores oficiales y autorizados, ComponentSource le suministra licencias legítimas directamente de LightningChart.

Premios recientes

PublisherPublisherPublisher