
Vizuly Column Chart
Añada gráficos de columnas apiladas y agrupadas a sus aplicaciones JavaScript.
Vizuly Professional includes all Vizuly components at a significant discount.
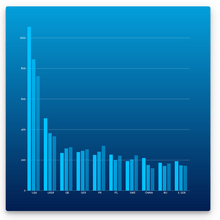
Vizuly Column Chart supports both stacked and clustered layout options, as well as over 2 dozen different dynamic styles. It also comes bundled with a test container and examples of different style based themes. You can use this component directly into your application using its straightforward API, or use it as a starting point for modification and extension.


Imagen 1 / 5
Features
Framework Adapters
Vizuly Column Chart también está disponible en:
Chatee en vivo ahora mismo con nuestros especialistas en licencias de Vizuly.
Tel: (888) 850 9911
Fax: +1 770 250 6199


