Componentes / Syncfusion / Vizuly / SoftArtisans - Productos más vendidos de

  1. Descripción: All of Syncfusion's user interface, reporting, and business intelligence components and libraries in one comprehensive suite. Syncfusion Essential Studio Enterprise Edition includes more than 1,700 components and frameworks for WinForms, WPF, ASP.NET ... Leer más

  2. $$$ | Compra

    Descripción: Send e-mail from your web applications. SoftArtisans SMTPMail is a full-featured SMTP e-mail client control which can be installed on your web server and used from any COM client (ASP, VB, WSH, etc.). It provides full control over attachments, multiple ... Leer más

  3. Descripción: Dependable and easy to use file transfer solution. FileUp Standard Edition (FileUpSE) transmits files from a local hard disk to a server-running Microsoft Internet Information Server (IIS) or to a separate file server that is networked to the Web server. ... Leer más

  4. $ | Compra

    Descripción: A radial line and area layout visualization. Vizuly Corona is a radial chart that provides angular and curved radial area line curves and supports both an overlap and stacked layout. It also features over a dozen different dynamic styles and comes bundled ... Leer más

  5. $ | Compra

    Descripción: Represent transactional relationships from a specified number of sources to a variable number of targets. Vizuly Halo uses several different data visualization techniques to represent transactional relationships from a specified number of sources to a ... Leer más

  6. $ | Compra

    Descripción: Represent cartesian x/y data within a radial plot. Vizuly Radial Bar is designed to represent cartesian x/y data within a radial plot. It supports both clustered and stacked radial bars Use the interactive style explorer on the left to view different ... Leer más

  7. $ | Compra

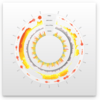
    Descripción: Easily display multi-variate time series information. Vizuly Ring Chart lets you easily display multi-variate time series information. Due to its radial form factor, you can display 3 times the information for a given screen width than you could with a ... Leer más

  8. $ | Compra

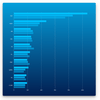
    Descripción: Add stacked and clustered bar charts to your JavaScript apps. Vizuly Bar Chart supports both stacked and clustered layout options, as well as over 2 dozen different dynamic styles. It also comes bundled with a test container and examples of different ... Leer más

  9. $ | Compra

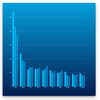
    Descripción: Add stacked and clustered column charts to your JavaScript apps. Vizuly Column Chart supports both stacked and clustered layout options, as well as over 2 dozen different dynamic styles. It also comes bundled with a test container and examples of ... Leer más

  10. $ | Compra

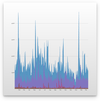
    Descripción: Add line and area charts to your JavaScript apps. Vizuly Line Area Chart supports both line and area plots in several different layout options. It also comes bundled with a test container demonstrating the various chart properties and different style ... Leer más