


Fournisseur officiel
Comme nous somme les distributeurs officiels et autorisés, nous vous fournissons des licences légitimes directement à partir de 200+ éditeurs de logiciels.
Voyez toutes nos marques.
Continuer de lire en anglais:
Infragistics Ultimate is a product suite that provides everything you need to create beautiful and engaging user interfaces, from a comprehensive library of UI controls to a complete design-to-code system. It simplifies development with a comprehensive library of enterprise-grade UI controls and UX Design-Development collaboration tools.
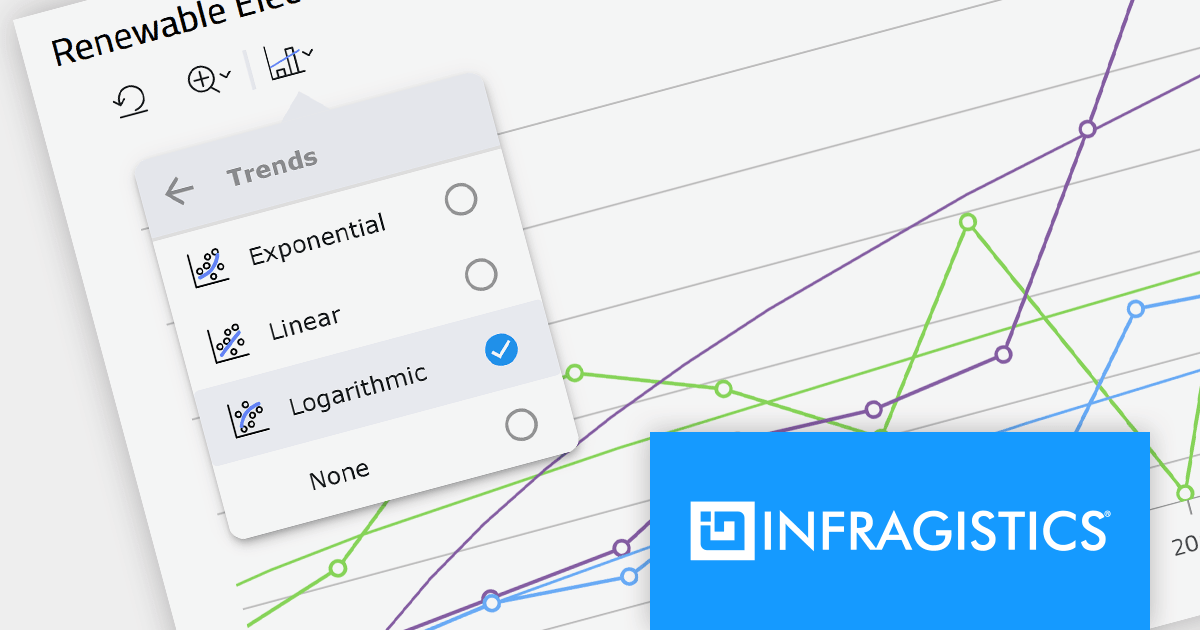
Version 23.1 introduces a new Chart Toolbar to App Builder, enabling you to deliver a next-generation visualization experience in your apps. The Chart Toolbar can access the chart's data in real time, allowing on-the-fly analysis of your data. It offers a variety of formatting options, including value overlays, data labels, crosshairs, and grid lines. You can also create custom buttons that extend the functionality of the toolbar.
For a full list of what's new in version 23.1, see our release notes.
For more information visit the Infragistics Ultimate product page.


Tél : (888) 850 9911
Fax : +1 770 250 6199


