


Fournisseur officiel
Comme nous somme les distributeurs officiels et autorisés, nous vous fournissons des licences légitimes directement à partir de 200+ éditeurs de logiciels.
Voyez toutes nos marques.
Continuer de lire en anglais:
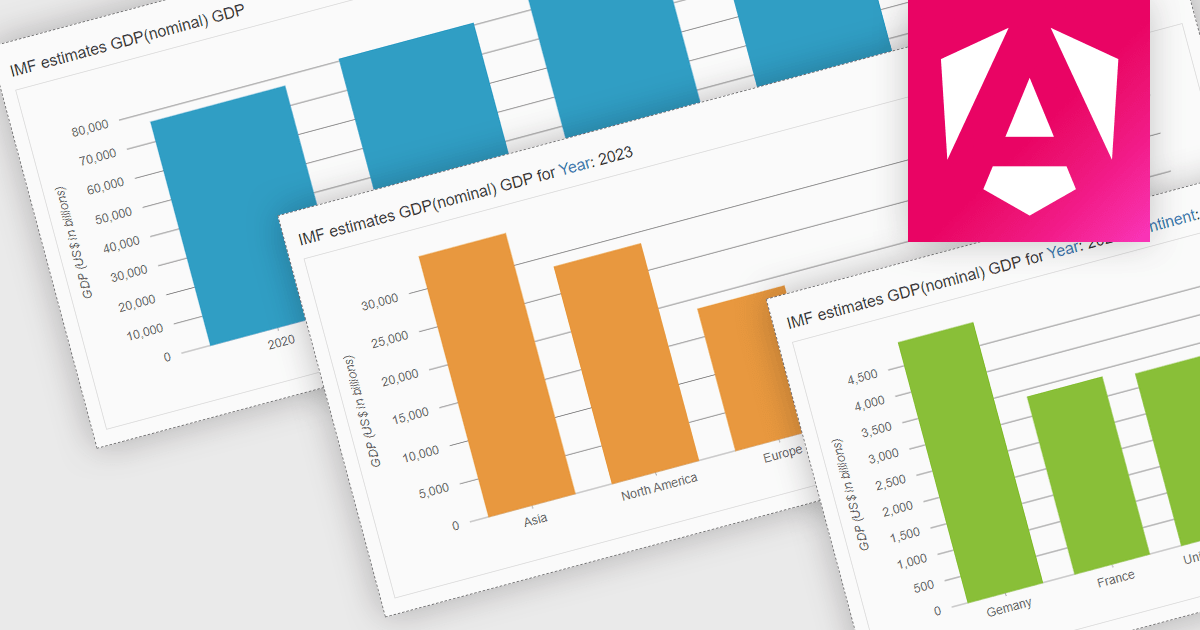
Drill-down charts are a type of interactive data visualization that allow users to explore hierarchical data by navigating multiple levels of detail. This makes them a powerful tool for analyzing complex data sets and uncovering hidden insights. By clicking on specific segments or elements within a chart, users can dynamically descend through the hierarchy, revealing granular details at each level. This process of zooming into specific data points empowers users to gain a deeper understanding of the overall trends and relationships within the dataset. Drill-down charts are particularly well-suited for analyzing sales figures, customer segmentation, and comparative performance metrics. Their ability to present data at multiple scales caters to users with diverse levels of data expertise, making them an accessible tool for data exploration and analysis.
Several Angular charting components provide drill down support including:
For an in-depth analysis of features and price, visit our Angular Chart comparison.


Tél : (888) 850 9911
Fax : +1 770 250 6199


