


Fournisseur officiel
Comme nous somme les distributeurs officiels et autorisés, nous vous fournissons des licences légitimes directement à partir de 200+ éditeurs de logiciels.
Voyez toutes nos marques.
Continuer de lire en anglais:
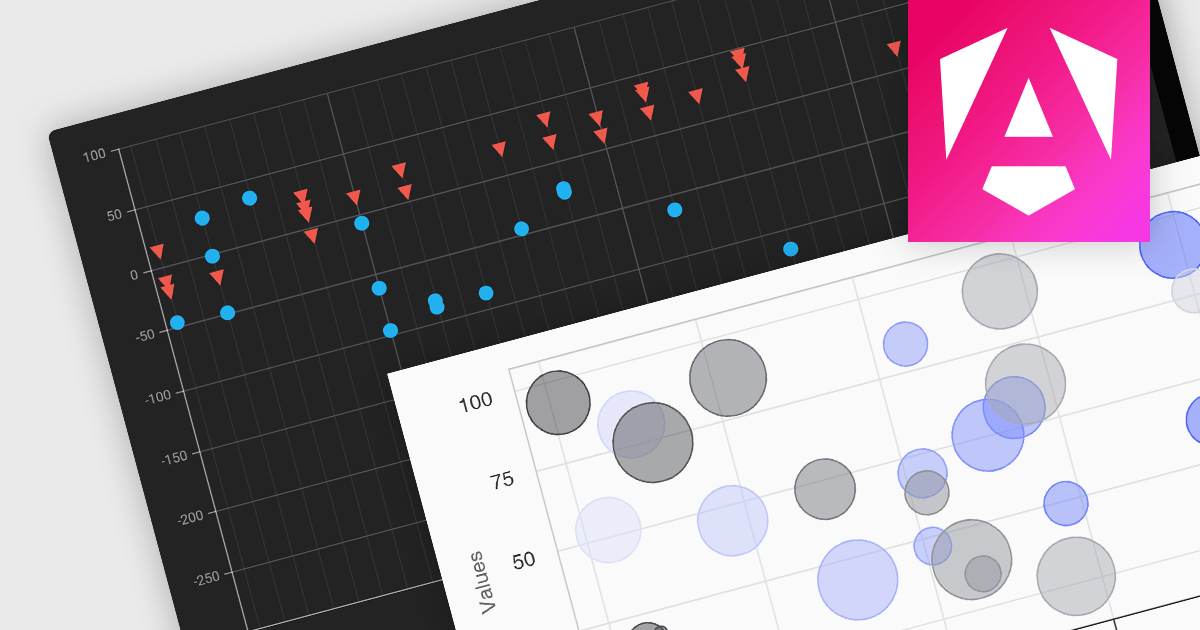
Scatter and bubble charts are used to display data points on a two-dimensional graph. While scatter charts use dots to represent data points, bubble charts add an additional dimension by varying the dot size, often representing volume or intensity. These charts are useful for showing relationships between variables and for identifying patterns or trends in data.
Several Angular chart controls offer scatter and bubble charts including:
For an in-depth analysis of features and price, visit our Angular chart controls comparison.


Tél : (888) 850 9911
Fax : +1 770 250 6199


