


Fournisseur officiel
Comme nous somme les distributeurs officiels et autorisés, nous vous fournissons des licences légitimes directement à partir de 200+ éditeurs de logiciels.
Voyez toutes nos marques.
Continuer de lire en anglais:
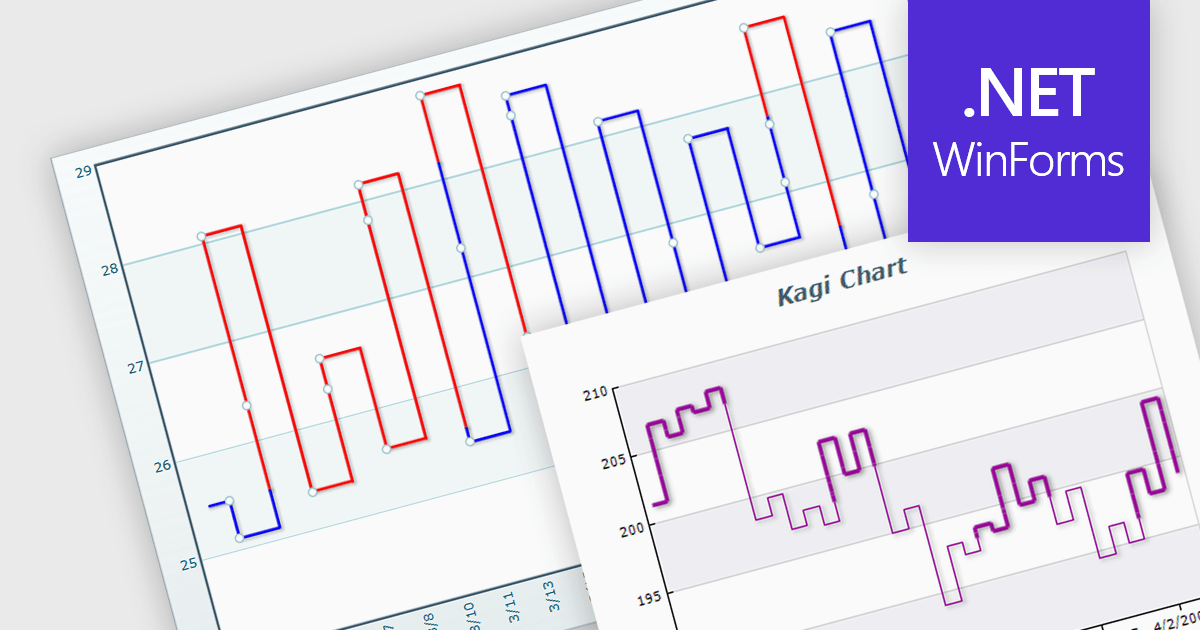
A Kagi chart is a type of financial chart used to track price movements, with a focus on significant trends and reversals rather than minor fluctuations, to inform stock purchasing decisions. It features a series of vertical lines that reflect changes in price. The direction of these lines shifts only when the price moves by a predetermined amount, known as the reversal amount. Thin lines indicate that the price has fallen below the previous low while thick lines indicate that the price has surpassed the previous high. By filtering out minor price fluctuations it emphasises substantial price movements, offering a clearer perspective on market trends.
Several WinForms chart components provide Kagi charts, including:
For an in-depth analysis of features and price, visit our WinForms charts comparison.


Tél : (888) 850 9911
Fax : +1 770 250 6199


