


Fournisseur officiel
Comme nous somme les distributeurs officiels et autorisés, nous vous fournissons des licences légitimes directement à partir de 200+ éditeurs de logiciels.
Voyez toutes nos marques.
Continuer de lire en anglais:
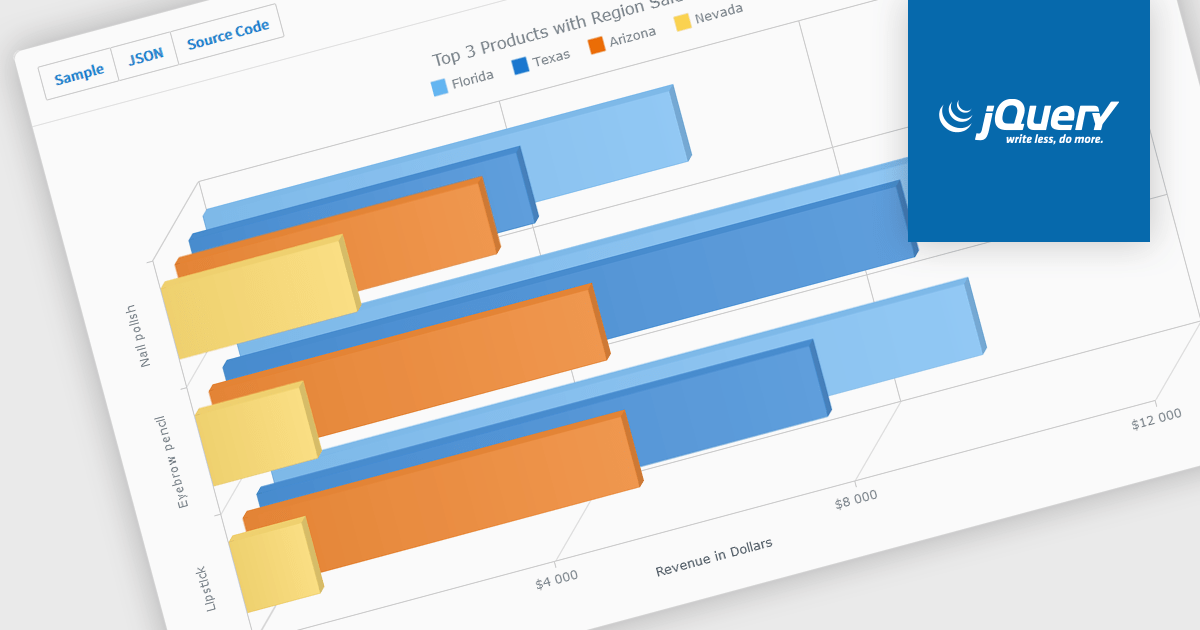
A selection of jQuery chart controls offer 3D capabilities, allowing data visualization to extend beyond the flat plane. This enables a more immersive and engaging user experience, particularly for complex datasets. Three-dimensional charts can be beneficial for highlighting patterns and relationships between multiple variables, making them ideal for scientific visualizations, financial data representation, or showcasing product features in a unique way.
Several jQuery chart controls offer 3D charts including:
For an in-depth analysis of features and price, visit our comparison of jQuery chart controls.


Tél : (888) 850 9911
Fax : +1 770 250 6199


