


Fournisseur officiel
Comme nous somme les distributeurs officiels et autorisés, nous vous fournissons des licences légitimes directement à partir de 200+ éditeurs de logiciels.
Voyez toutes nos marques.
Continuer de lire en anglais:
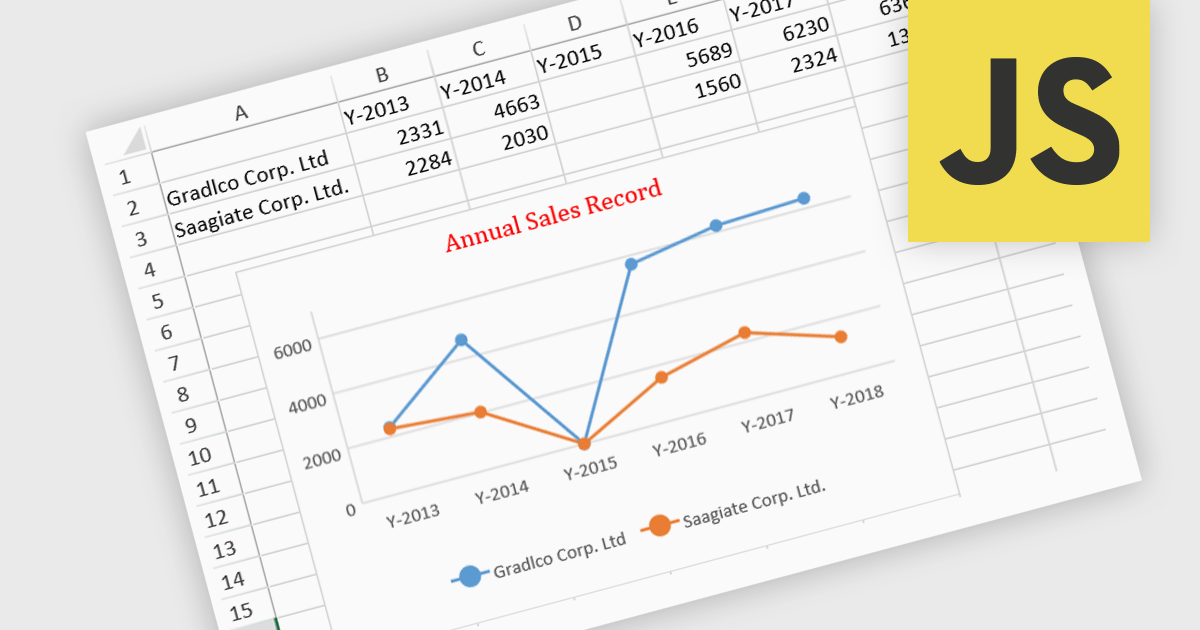
JavaScript spreadsheet controls with built-in chart features enable developers to visualize data directly within web-based spreadsheet applications. These charts are generated dynamically from the data within the spreadsheet, providing users with a more intuitive way to analyze and interpret complex datasets. By integrating charting capabilities, developers can offer real-time data visualization without relying on external libraries, resulting in more efficient user experiences. This functionality improves data-driven decision-making, enhances user engagement, and reduces the complexity of handling complex datasets in web applications.
Several JavaScript spreadsheet controls offer charts including:
For an in-depth analysis of features and price, visit our comparison of JavaScript Spreadsheet controls.


Tél : (888) 850 9911
Fax : +1 770 250 6199


