


Fournisseur officiel
Comme nous somme les distributeurs officiels et autorisés, nous vous fournissons des licences légitimes directement à partir de 200+ éditeurs de logiciels.
Voyez toutes nos marques.
Continuer de lire en anglais:
Stimulsoft Dashboards.WEB is a versatile suite of tools for crafting interactive data visualizations for web and desktop applications. It empowers developers to embed intuitive dashboards across various platforms, using the platform-specific components or a centralized cloud designer. With rich data analysis elements, extensive customization options, and pre-built templates, Stimulsoft Dashboards helps you transform complex data into clear, actionable insights for any audience.
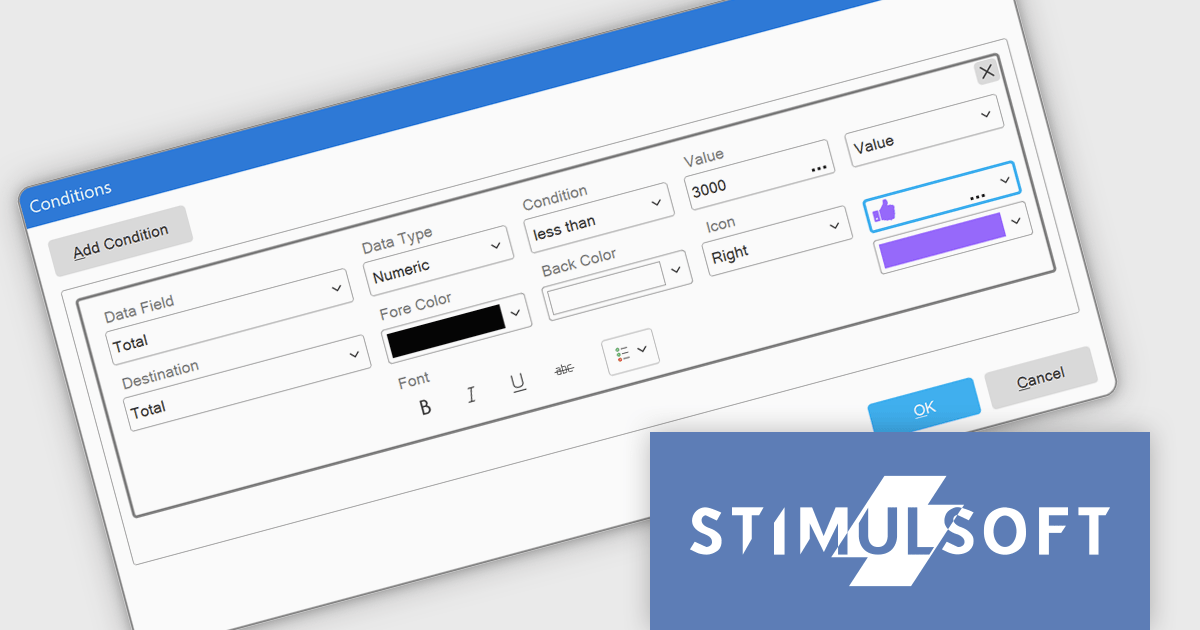
The Stimulsoft Dashboards.WEB 2025.1.1 update introduces the ability to apply visual indicators in conditional formatting for table elements, providing users with a powerful tool to enhance data visualization. This feature allows icons or custom uploaded images to be dynamically applied to table cells based on predefined conditions, enabling more precise and intuitive representation of data. By integrating this functionality, developers can create dashboards that effectively highlight critical information, improve data readability, and deliver a more engaging user experience, all while maintaining flexibility for customization and alignment with specific project needs.
To see a full list of what's new in 2025.1.1, see our release notes.
Stimulsoft Dashboards.WEB is licensed per developer and is available as a perpetual license with 1 year support and maintenance. See our Stimulsoft Dashboards.WEB licensing page for full details.
Stimulsoft Dashboards.WEB is available individually or as part of Stimulsoft Ultimate.


Tél : (888) 850 9911
Fax : +1 770 250 6199


