


Fournisseur officiel
Comme nous somme les distributeurs officiels et autorisés, nous vous fournissons des licences légitimes directement à partir de 200+ éditeurs de logiciels.
Voyez toutes nos marques.
Continuer de lire en anglais:
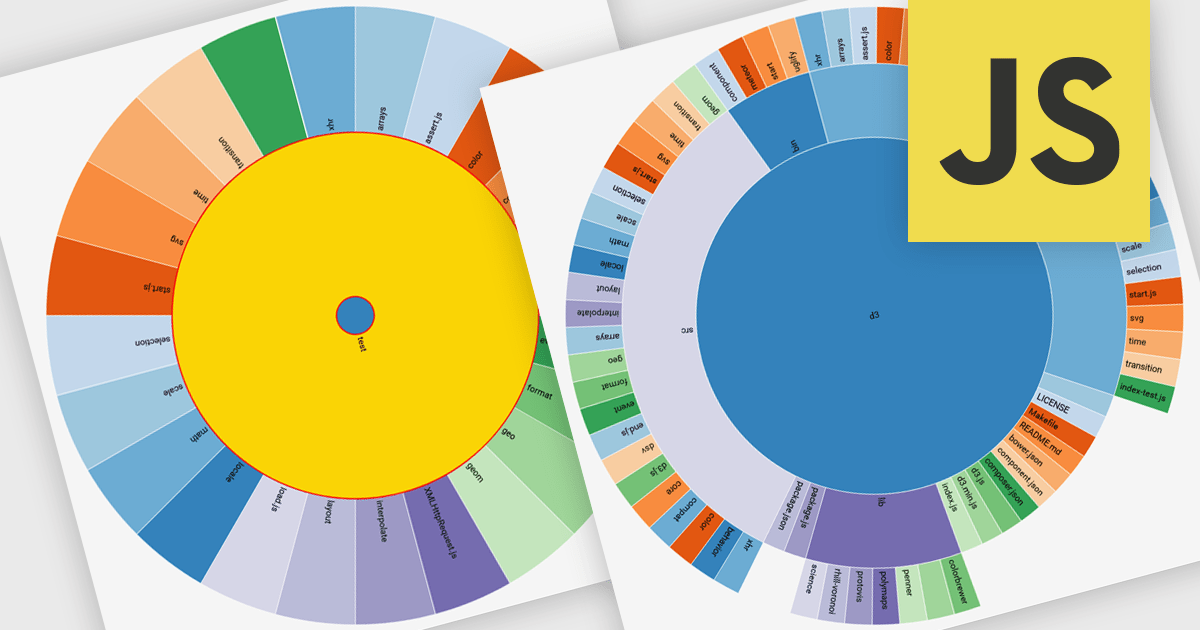
Radial charts are circular data visualizations used to represent hierarchical, proportional, or cyclical data. A key type is the sunburst chart, which displays multi-level hierarchies using concentric rings, where each ring represents a level and each segment shows a category or subcategory. This format helps users quickly grasp both structure and proportion. Sunburst charts are ideal for exploring complex data in a compact space and are commonly used for visualizing organizational charts, file systems, website structures, and product categories. Their interactive format allows users to drill into data for deeper insight without losing context.
Several JavaScript charting components provide you with radial charts, including:
For an in-depth analysis of features and price, visit our JavaScript chart components comparison.


Tél : (888) 850 9911
Fax : +1 770 250 6199


