


Fournisseur officiel
Comme nous somme les distributeurs officiels et autorisés, nous vous fournissons des licences légitimes directement à partir de 200+ éditeurs de logiciels.
Voyez toutes nos marques.
Continuer de lire en anglais:
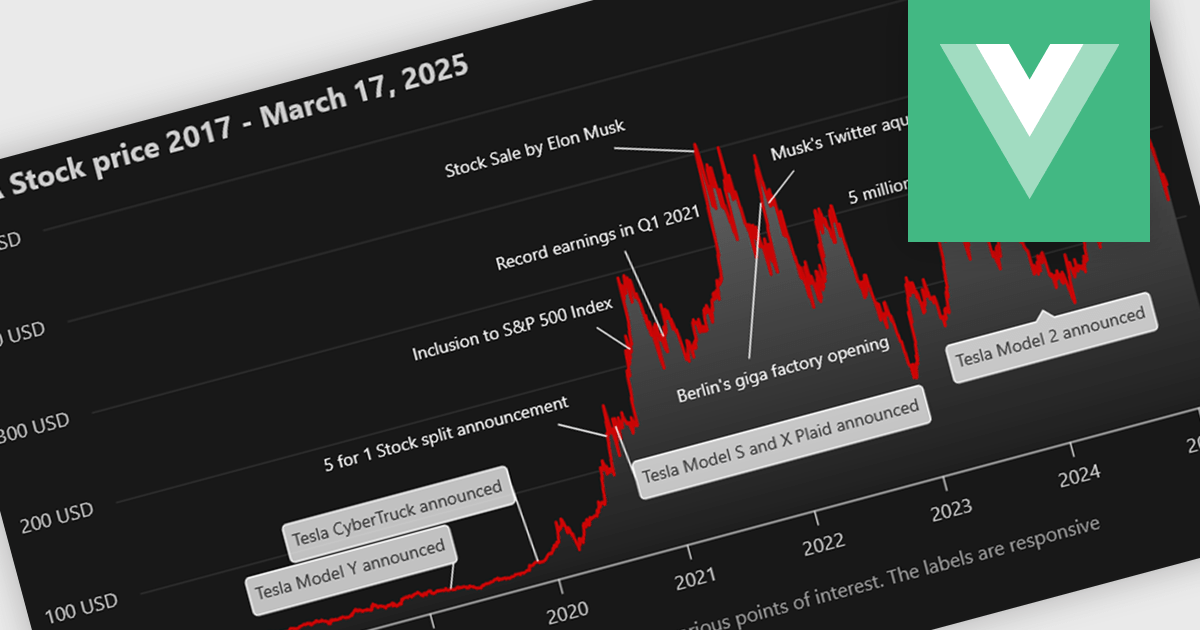
Annotation support in a Vue.js chart component refers to the capability to overlay additional contextual elements, such as labels, markers, lines, or regions, directly onto a chart to highlight specific data points, thresholds, or events. This feature enables developers to enrich visualizations with meaningful insights without altering the underlying dataset, making it easier to communicate key information such as trends, anomalies, or business rules within the UI.
Several Vue.js chart components support chart annotations, including:
For an in-depth analysis of features and price, visit our comparison of Vue.js charting components.


Tél : (888) 850 9911
Fax : +1 770 250 6199


