


Fournisseur officiel
Comme nous somme les distributeurs officiels et autorisés, nous vous fournissons des licences légitimes directement à partir de 200+ éditeurs de logiciels.
Voyez toutes nos marques.
Continuer de lire en anglais:
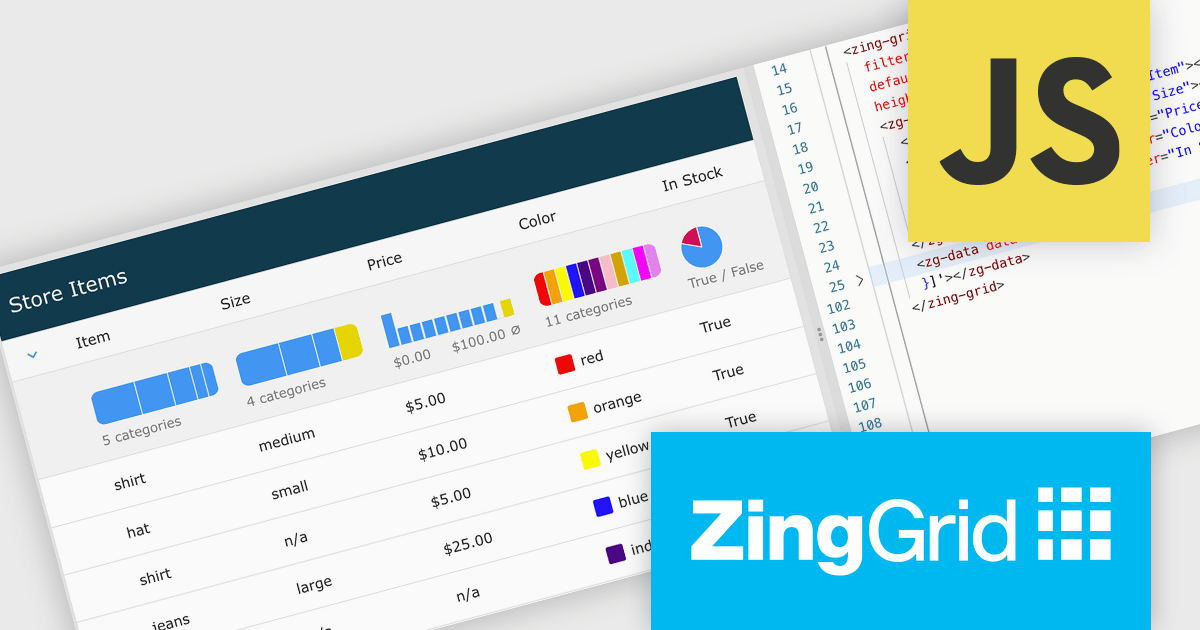
ZingGrid is a JavaScript library that simplifies the creation of interactive data tables and grids within web applications. Utilizing modern web components and focusing on performance and responsiveness, ZingGrid allows developers to implement features like searching, filtering, pagination, and in-line editing with minimal coding. This empowers efficient data visualization and manipulation for users, making it a valuable tool for web development.
The ZingGrid 2.2.0 update introduces a Filter Summary Chart that enables users to visually explore and filter data through an interactive chart interface, making it easier to identify patterns, trends, and distributions within large datasets. By combining data visualization with filtering functionality, the feature helps users refine results more intuitively and efficiently than traditional filter controls, while allowing developers to quickly add this capability at either the grid or column level with minimal configuration.
To see a full list of what's new in version 2.2.0, see our release notes.
ZingGrid is available as either a Single-Domain Website or Multi-Domain SaaS license. See our ZingGrid licensing page for full details.
For more information, visit our ZingGrid product page.


Tél : (888) 850 9911
Fax : +1 770 250 6199


