








Fournisseur officiel
Comme nous somme les distributeurs officiels et autorisés, nous vous fournissons des licences légitimes directement à partir de 200+ éditeurs de logiciels.
Voyez toutes nos marques.
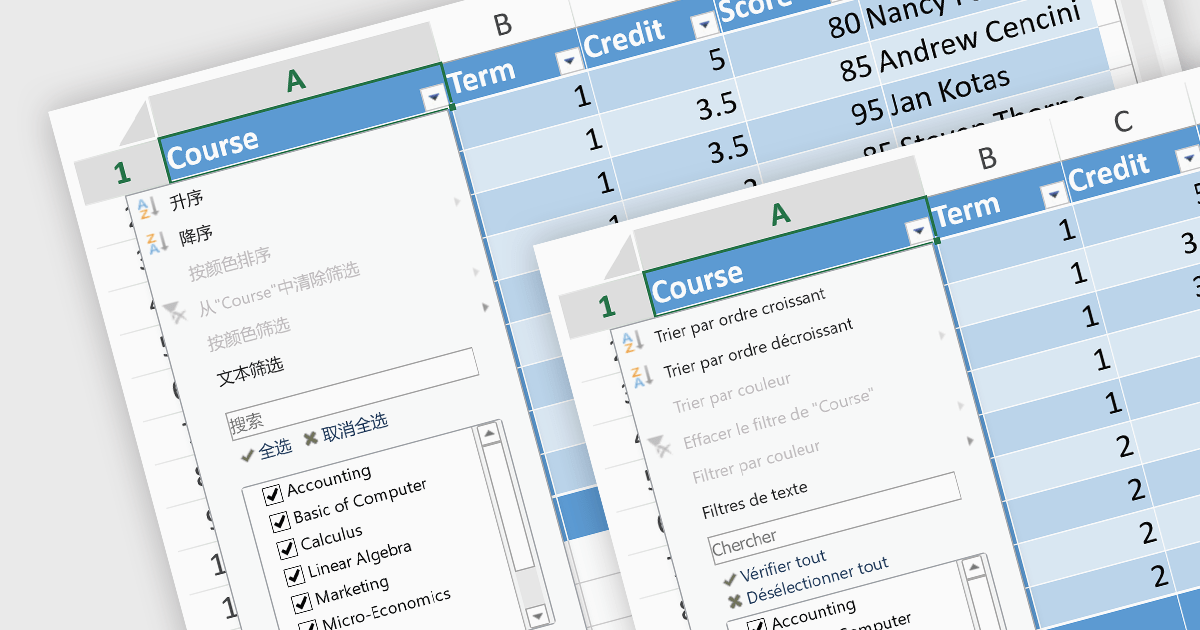
In spreadsheet controls, localization refers to adapting the user interface and functionality to different languages and cultural contexts. This involves translating static text like menu labels and buttons, formatting dates and numbers according to regional conventions, and even adjusting features like formula syntax to match users' expectations. Effective localization ensures intuitive interaction for global audiences, boosting user adoption and enhancing the overall spreadsheet experience.
Several Angular spreadsheet controls support localization including:
For an in-depth analysis of features and price, visit our Angular Spreadsheet Controls comparison.

MDBootstrap Pro Angular (MDB Pro Angular) is a UI component library that combines Material Design aesthetics with the Bootstrap and Angular frameworks. It empowers developers to craft visually appealing and interactive web applications with ease, offering an extensive collection of pre-built components like modals, charts, carousels, and data tables. Tailored for professional projects, it unlocks advanced features like dark mode theming, advanced form controls, and integrated charting libraries, all while adhering to industry-leading coding standards and comprehensive documentation for a smooth development experience.
MDB Pro Angular v6.0.0 adds support for Angular 17, which boasts a game-changing application builder for dramatically faster build times, a streamlined control flow syntax for enhanced developer productivity, and an optimized lazy loading system with Deferrable views that enable both declarative and deferred loading for improved initial rendering speeds. This powerful combination empowers developers to craft even more robust and performant web applications with greater ease.
To see a full list of what's new in version 6.0.0, see our release notes.
MDB Pro Angular is licensed per developer, per project/domain with packages for individual developers, development teams and Enterprises. See our MDB Pro Angular licensing page for full details.
For more information, visit our MDB Pro Angular product page.
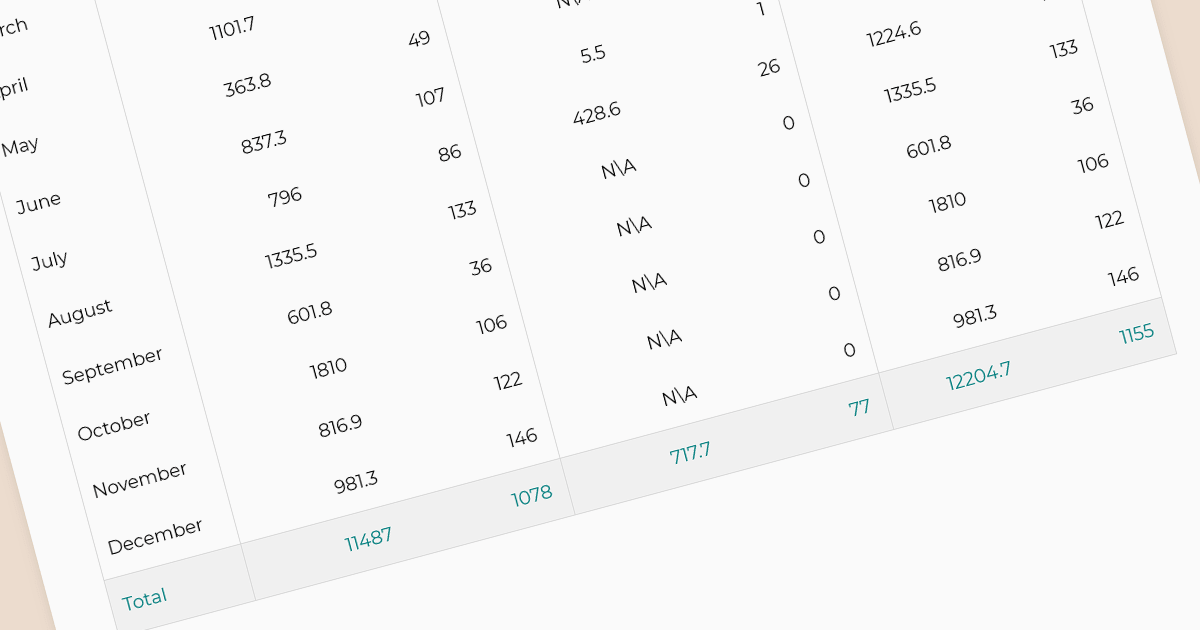
In reporting tools, summaries and aggregates are powerful tools for condensing and presenting large datasets into meaningful insights. Summaries condense data by highlighting key points, such as averages, counts, or maxima/minima, often using text or visuals. Aggregates mathematically combine data points, like calculating sums, means, or medians, typically displayed in tables or charts. Both approaches help users quickly grasp the essence of the data, identify trends, and make informed decisions. Summaries act as concise narratives and aggregates as numerical snapshots, working together to paint a clear picture from complex information.
The following Angular reporting components support summaries and aggregates:
For an in-depth analysis of features and price, visit our Angular Reporting Components comparison.
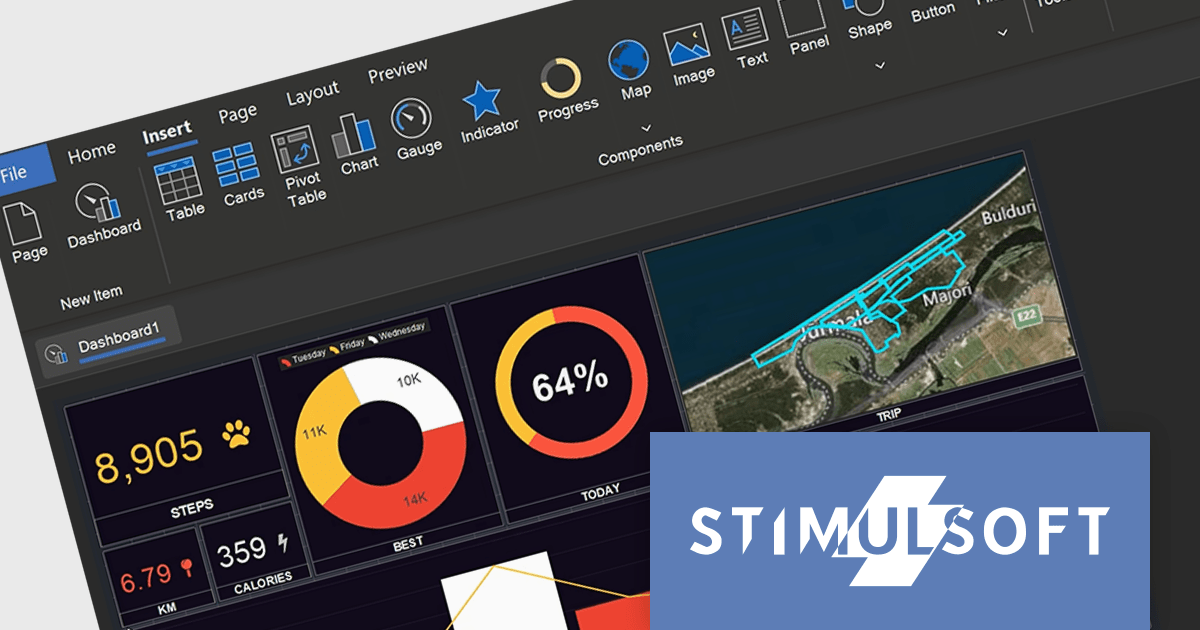
Stimulsoft Dashboards.WEB is a powerful tool designed to seamlessly integrate interactive dashboards into ASP.NET, .NET Core, ASP.NET MVC, and Blazor web applications. It offers extensive data analysis and visualization elements, which empower you to create insightful dashboards for various purposes, from sales and marketing to HR and finance. Boasting flexible data connectivity, professional design templates, and a user-friendly interface, Stimulsoft Dashboards.WEB streamlines the process of crafting impactful dashboards that effectively communicate key business metrics and trends.
The 2024.1.1 release of Stimulsoft Dashboards.WEB adds a set of tools for designing, viewing and converting dashboards for Angular, boosting efficiency, enhancing user experience with interactive visualizations, and simplifying integration with server-side data processing.
To see a full list of what's new in version 2024.1.1, see our release notes.
Stimulsoft Dashboards.WEB is licensed per developer and is available as a Perpetual license 1 year support and maintenance. See our Stimulsoft Dashboards.WEB licensing page for full details.
For more information, visit our Stimulsoft Dashboards.WEB product page.
Stimulsoft Reports is a versatile reporting tool that lets you create and generate reports of any complexity from scratch, whether for desktop, web, or mobile platforms. It provides a visual designer and royalty-free runtime that integrates seamlessly with various frameworks like ASP.NET, Java, and JavaScript, empowering applications to generate insightful reports with rich features and diverse export options.
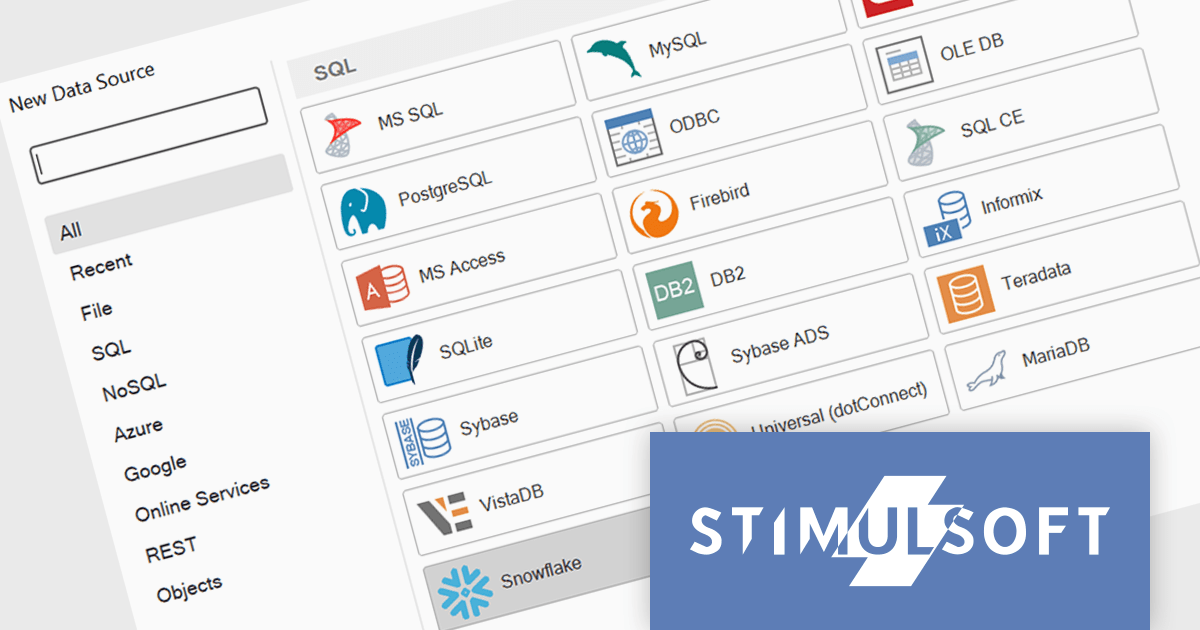
The 2024.1.1 release of Stimulsoft Reports adds a new data adapter for Snowflake, a widely used cloud data storage services, adept at handling both semi-structured and structured data. Developers can now utilize Stimulsoft's robust reporting capabilities to analyze Snowflake data directly, eliminating the need for manual data extraction or intermediary tools. This translates to faster report generation, improved data accuracy, and seamless integration with Snowflake's powerful cloud storage and performance.
To see a full list of what's new in version 2024.1.1, see our release notes.
Stimulsoft Ultimate is licensed per developer and is available as a Perpetual license with 1 year support and maintenance. See our Stimulsoft Ultimate licensing page for full details.
Stimulsoft Reports is available to buy in the following products:





Tél : (888) 850 9911
Fax : +1 770 250 6199


