








Fournisseur officiel
Comme nous somme les distributeurs officiels et autorisés, nous vous fournissons des licences légitimes directement à partir de 200+ éditeurs de logiciels.
Voyez toutes nos marques.
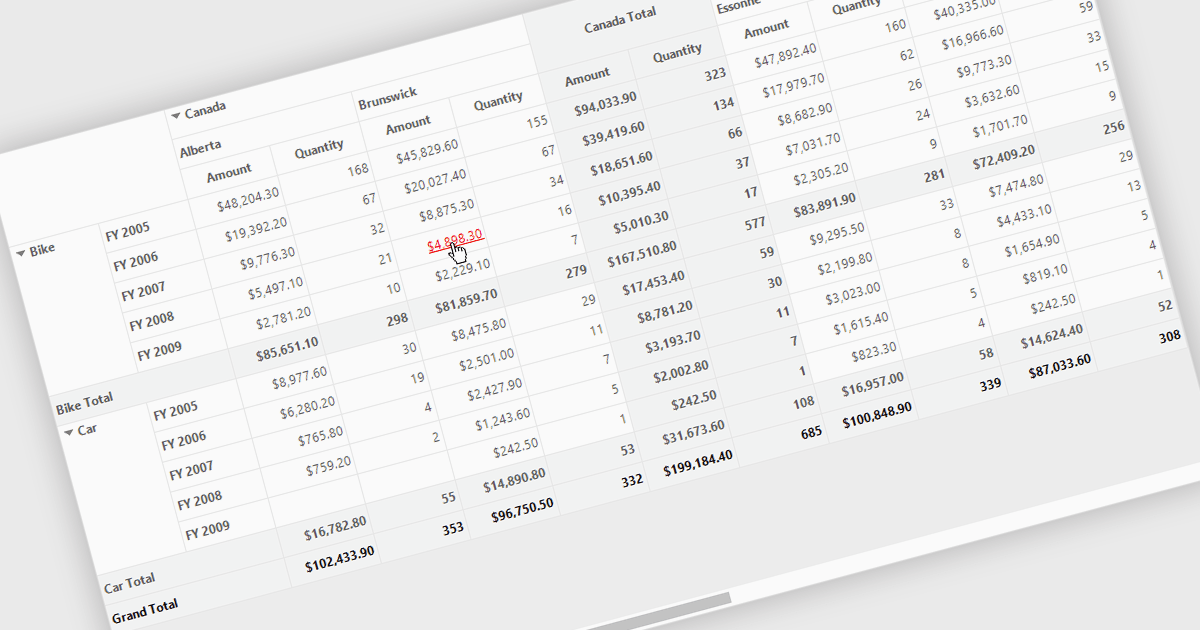
Hyperlinks in grids allow individual cells to function as clickable links, enabling users to navigate directly to related records, pages, or external resources. This makes data more interactive and improves usability by reducing manual searching. Users can quickly access additional context such as detailed views, reports, or linked systems without leaving the grid. Common use cases include linking customer names to profiles, order IDs to transaction details, or connecting data to external documentation, helping improve productivity and efficiency.
Several .NET WinForms grid controls offer hyperlink cell types, including:
For an in-depth analysis of features and price, visit our .NET WinForms grid controls comparison.
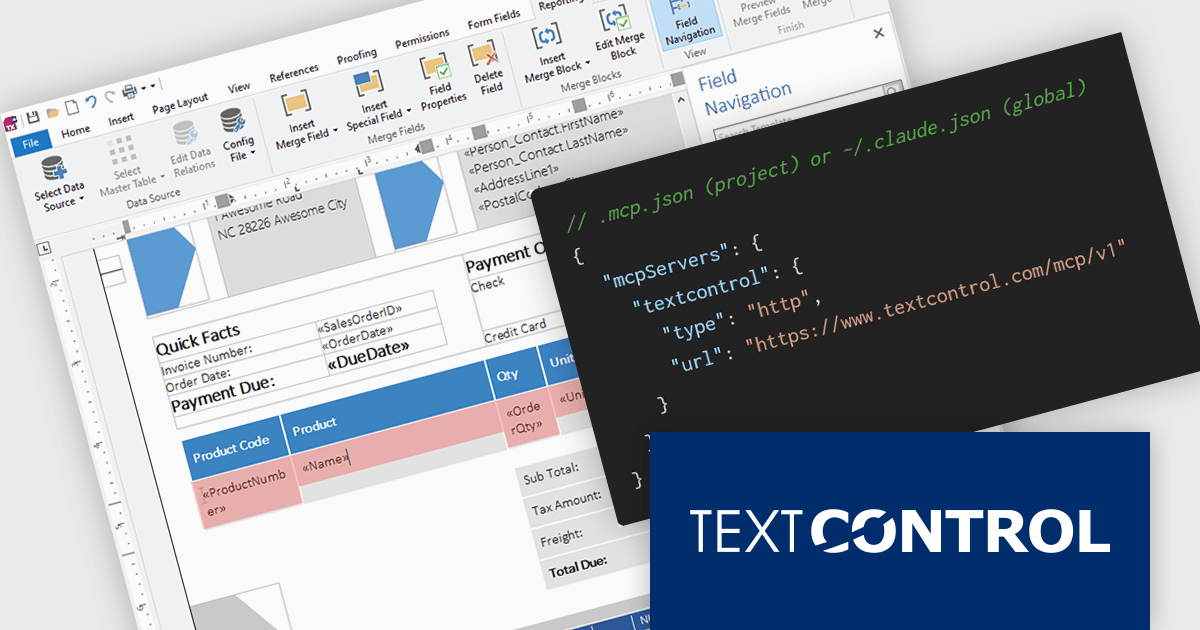
TX Text Control .NET is a royalty-free, fully programmable document editor that empowers developers to add rich WYSIWYG word processing to desktop and web applications across various platforms. It provides everything from comprehensive text formatting and mail merge to PDF creation and processing, all through a robust API and intuitive user interface.
The new Text Control MCP Server introduces a read-only Model Context Protocol (MCP) endpoint designed to integrate authoritative product knowledge into AI-assisted processes. By adding a single URL to an assistant’s configuration, developers can enable access to blog content, documentation, API references, and more, all without leaving the editor. This approach improves the relevance and accuracy of AI-generated responses, making it easier to work with up-to-date information across the entire Text Control ecosystem.
TX Text Control .NET for Windows Forms and TX Text Control .NET for WPF are licensed per developer and are available as a Perpetual License with a 12 month support and maintenance subscription. See our TX Text Control .NET for Windows Forms licensing page or TX Text Control .NET for WPF licensing page for full details.
TX Text Control .NET is available to buy in the following products:
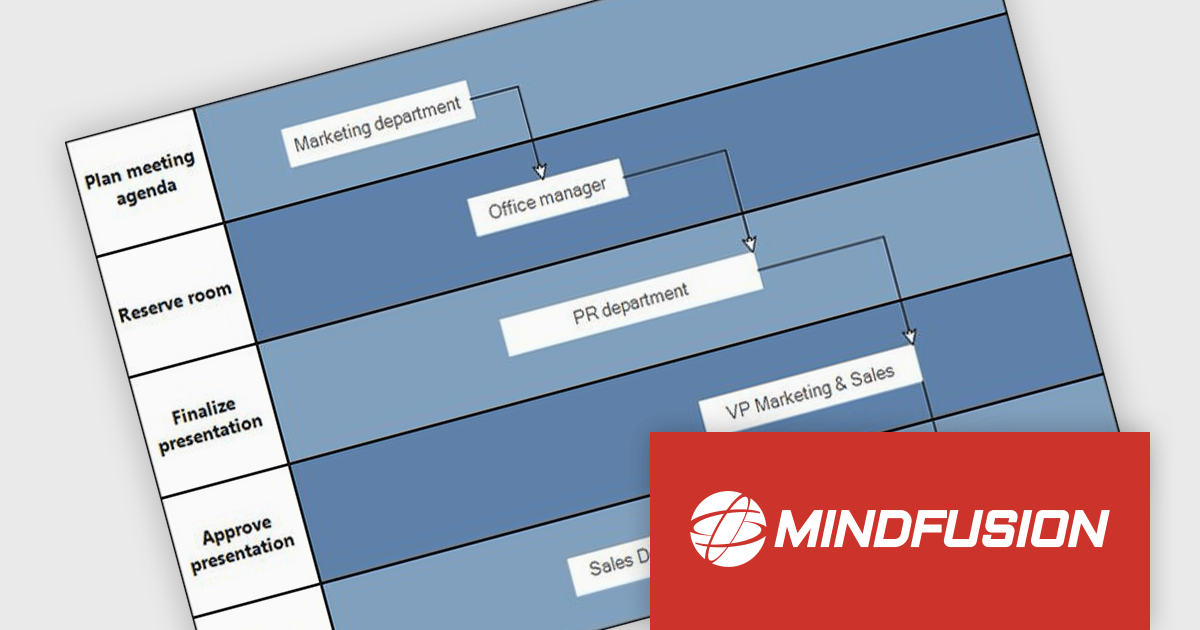
MindFusion.Diagramming for WinForms is a versatile diagramming component that enables developers to create and present workflows, process diagrams, database models, organizational charts, and more. It includes over 100 predefined node shapes, flexible table objects with unlimited rows and columns, and container nodes that can be nested to represent complex structures. With customizable links and arrowhead styles, it helps build clear and interactive visualizations, making it easier to organize information, communicate ideas, and support a wide range of business and technical applications.
The MindFusion.Diagramming for WinForms 7.2 update introduces the new Palette control, providing developers with a structured way to organize and present diagram elements within categorized, collapsible panels. This feature improves usability by enabling efficient navigation and selection of items, particularly in applications with large or complex sets of diagrams. With flexible APIs for adding categories and items programmatically or through collections, the Palette control improves development while supporting scalable user interfaces for diagram-driven applications.
To see a full list of what’s new in version 7.2, see our release notes.
MindFusion.Diagramming for WinForms is licensed per developer, per site, or across an entire enterprise with perpetual licensing. All options include royalty free distribution with no additional runtime or end user fees. See our MindFusion.Diagramming for WinForms licensing page for full details.
For more information, visit our MindFusion.Diagramming for WinForms product page.
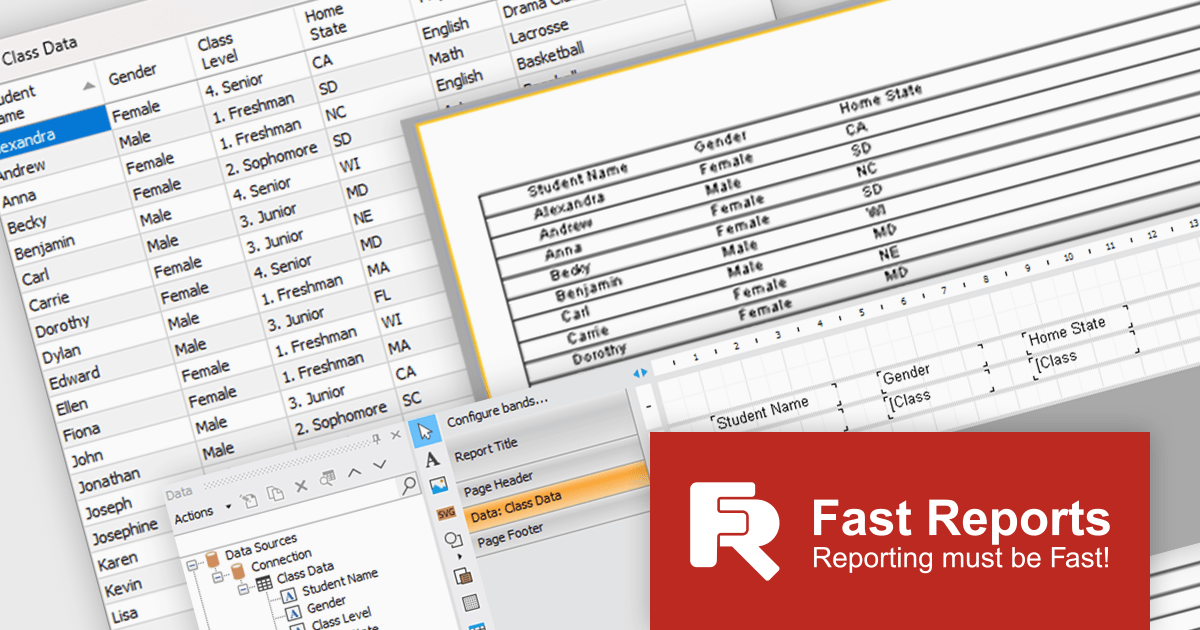
FastReport .NET Ultimate is a comprehensive reporting solution for developers working within the Microsoft .NET ecosystem. It supports the creation, design, and delivery of rich, interactive reports across Windows Forms, ASP.NET, MVC, and .NET Core applications. The Ultimate edition includes server deployment capabilities and extensive export options, such as PDF, Excel, Word, and HTML. It connects to various data sources, including SQL databases and business objects, providing flexibility for enterprise-level reporting. With the integrated FastReport Online Designer, users can edit reports directly in their browsers, enabling efficient collaboration and modern, full-featured report design across both desktop and web platforms.
The latest FastReport .NET Ultimate update introduces support for Google Sheets as a data source, allowing reports to connect directly to cloud-based spreadsheets. It enables developers and data professionals to work with up-to-date information without manual data transfers, making it easier to incorporate shared or frequently updated datasets into reports. It simplifies access to external data while maintaining the familiar reporting experience, making it particularly useful for teams already relying on Google Sheets for data management.
FastReport .NET Ultimate is licensed per named user and is available as a perpetual license with a one-year subscription for updates and support. See our FastReport .NET Ultimate licensing page for full details.
For more information, visit our FastReport .NET Ultimate product page.

ComponentSource and AlterNET Software have built a long standing partnership focused on making advanced .NET development tools more accessible to developers worldwide. AlterNET Software provides UI controls and frameworks for code editing, scripting, and UI design, enabling developers to extend applications with custom functionality across WinForms, WPF, and other .NET platforms.
A key part of this collaboration is their product AlterNET Studio, which brings together code editing, scripting, debugging, and UI design features into a single toolkit that developers can embed directly into their applications.
Through this partnership, ComponentSource expands its range of specialized developer tools, helping it stand out beyond standard UI libraries while supporting global distribution, licensing, and access to AlterNET Software products.
Learn more about AlterNET Software.





Tél : (888) 850 9911
Fax : +1 770 250 6199


