


Fournisseur officiel
Comme nous somme les distributeurs officiels et autorisés, nous vous fournissons des licences légitimes directement à partir de 200+ éditeurs de logiciels.
Voyez toutes nos marques.
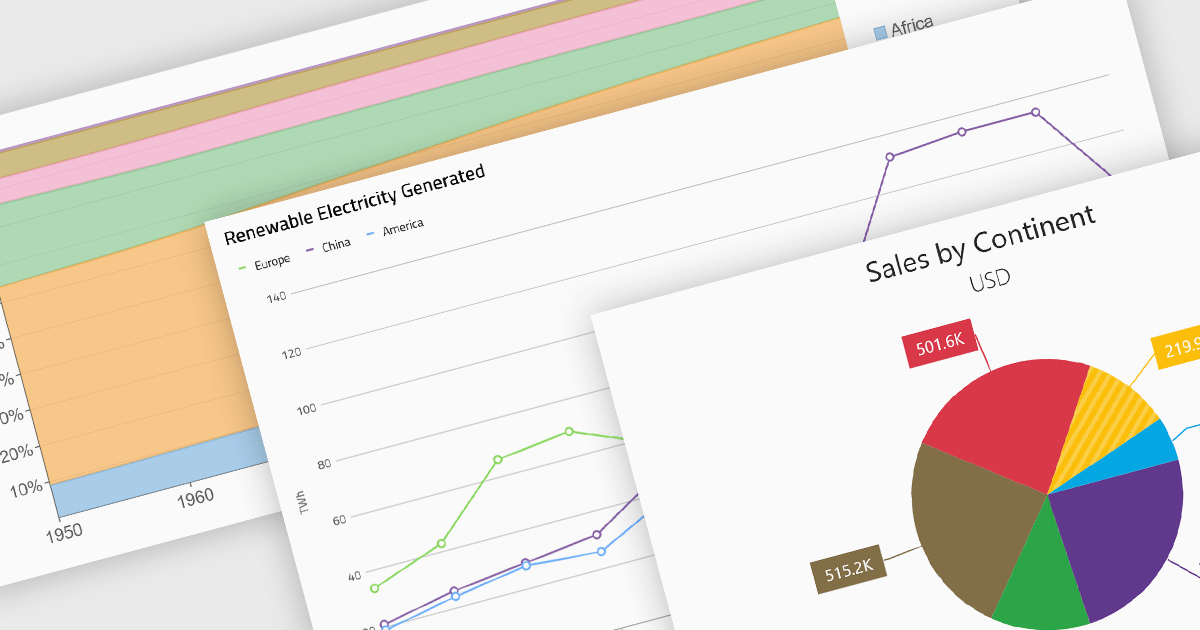
Standard chart types form the foundation of most charting components, providing widely recognized visual formats for representing numerical and categorical data. These charts help developers present trends, comparisons, distributions, and relationships in ways that are immediately understandable to end users. Because these visualizations are familiar across industries, they are commonly included as built-in options in charting libraries and dashboards, allowing applications to communicate insights clearly while supporting interactive features such as tooltips, legends, and dynamic data updates.
Common chart types include:
For an in-depth analysis of features and price, visit our Blazor charts components comparison.
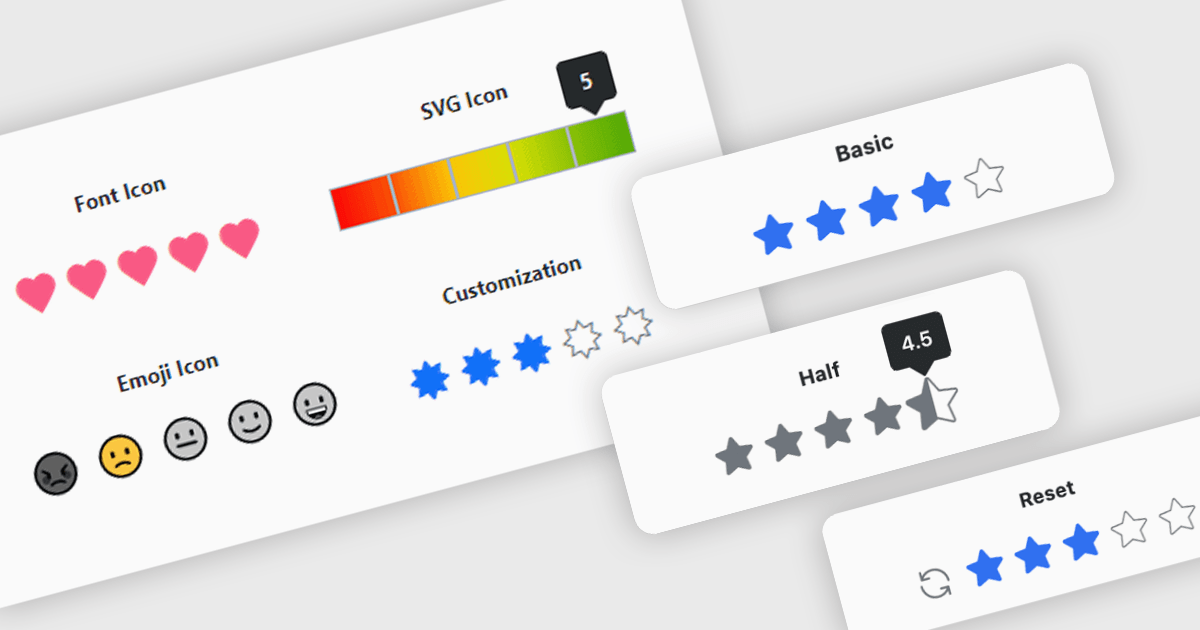
A rating feature in a data editor allows users to assign a value, typically through icon based controls such as stars or similar symbols, directly within a grid or form to evaluate related content. By transforming subjective opinions into structured, quantifiable data, rating components make feedback easy to capture, analyze, and display. This enhances user engagement and supports more informed decision making based on aggregated insights. Common use cases include rating products in ecommerce dashboards, evaluating service performance in internal business systems, scoring support tickets by priority or satisfaction, and assessing content quality within content management platforms.
Several Blazor data editor collections provide rating controls including:
For an in-depth analysis of features and price, visit our Blazor Data Editors comparison.
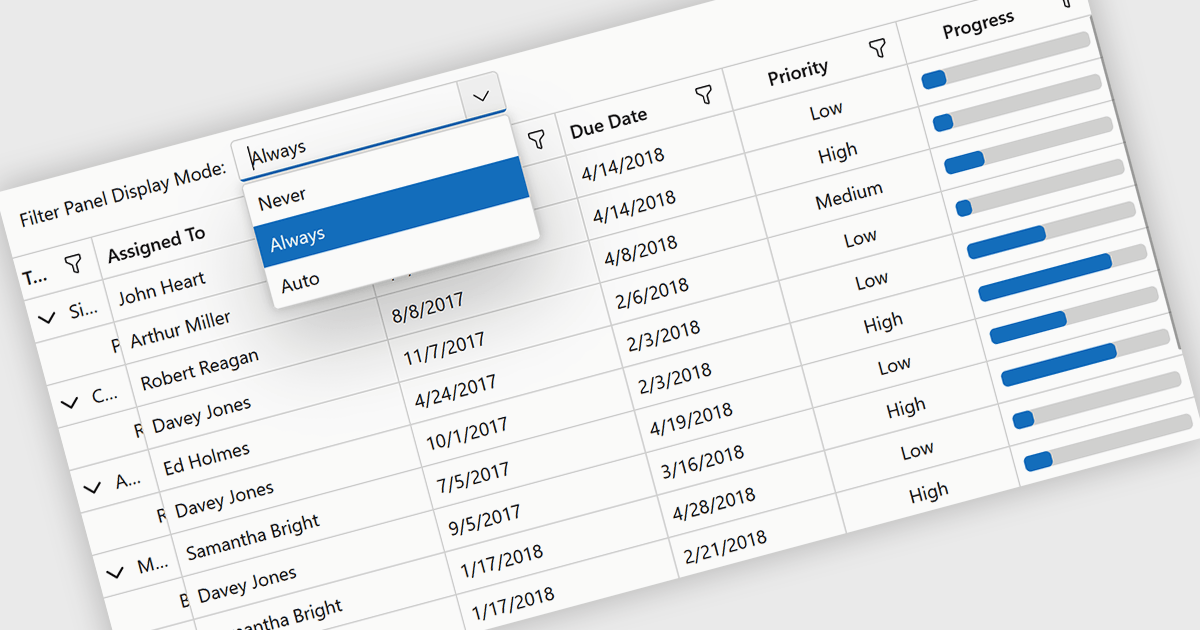
Grid filtering allows users to display only selected rows or columns by choosing specific values, categories, or ranges without modifying the underlying dataset. This capability simplifies navigation through large volumes of data and helps users focus immediately on the most relevant information. By minimizing manual searching and enabling faster comparisons, grid filtering improves productivity and supports more informed decision making. Common use cases include filtering sales data by date range, isolating transactions above a certain value, analyzing results by region or product category, and hiding non essential columns to create clearer, presentation ready reports.
Several .NET Blazor grid controls offer filtering support including:
For an in-depth analysis of features and price, visit our comparison of .NET Blazor grids.
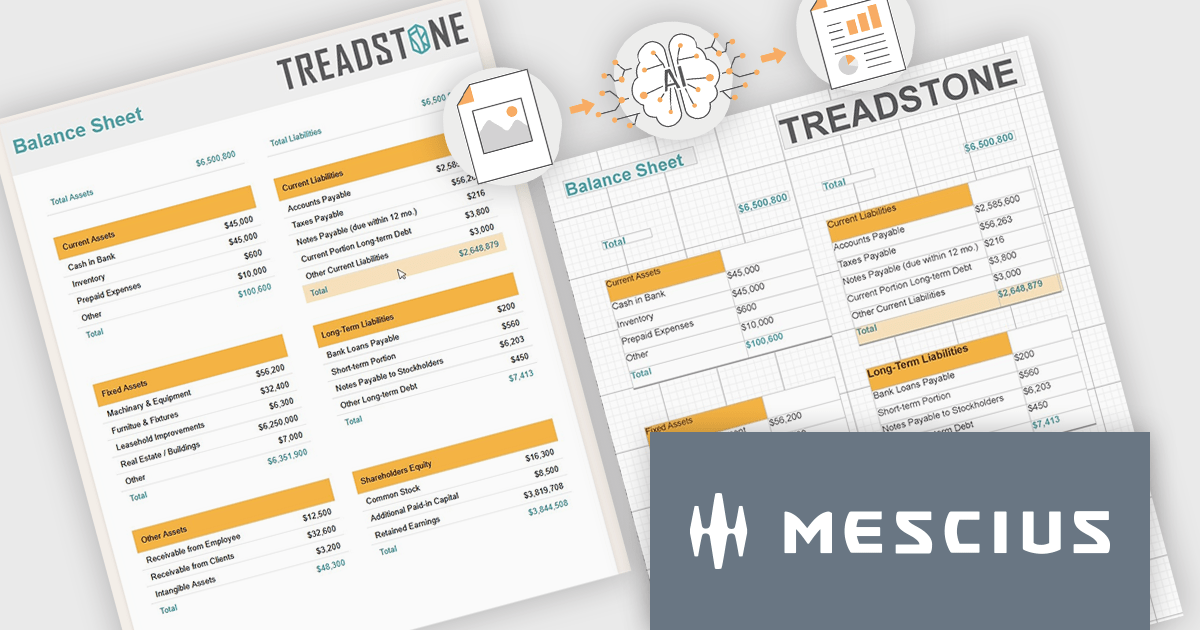
ActiveReports.NET by MESCIUS is a reporting solution for the Microsoft .NET platform that enables developers to create and deliver data-driven reports in web, desktop, and cloud applications. It supports multiple report types, including section, page, and RDL (Report Definition Language) reports, and provides visual designers, a robust rendering engine, and export options such as PDF and Excel. Designed to integrate with modern .NET and ASP.NET Core applications, it helps teams build interactive, enterprise-grade reporting features into their software.
The ActiveReports.NET v20 update introduces a new AI powered image to report capability that enables developers to convert static report images such as screenshots, mockups, PDFs, or even photos of printed pages into fully editable report layouts in minutes. By leveraging Azure Document Intelligence to analyze page structure, text, and visual elements, it significantly reduces the manual effort required to recreate existing reports, accelerates the modernization of legacy assets, and streamlines migrations from other reporting platforms. This capability provides a practical starting point for rebuilding or refining reports while preserving full control over layout structure, styling, grouping, and data bindings to ensure alignment with application architecture and development standards.
To see a full list of what's new in v20, see our release notes.
ActiveReports.NET is licensed per developer. Dependent on geographic location it is available as either an Annual (Timed) Subscription License or as a Perpetual Developer License which comes with 1 year of software updates and support. Each developer requires a license to design, develop, or maintain applications. The Annual Subscription License must be renewed each year to continue to work with the software. Published applications are royalty free and do not expire. Optional pipeline licenses available for CI/CD build servers. See our ActiveReports.NET licensing page for full details.
Learn more on our ActiveReports.NET product page.
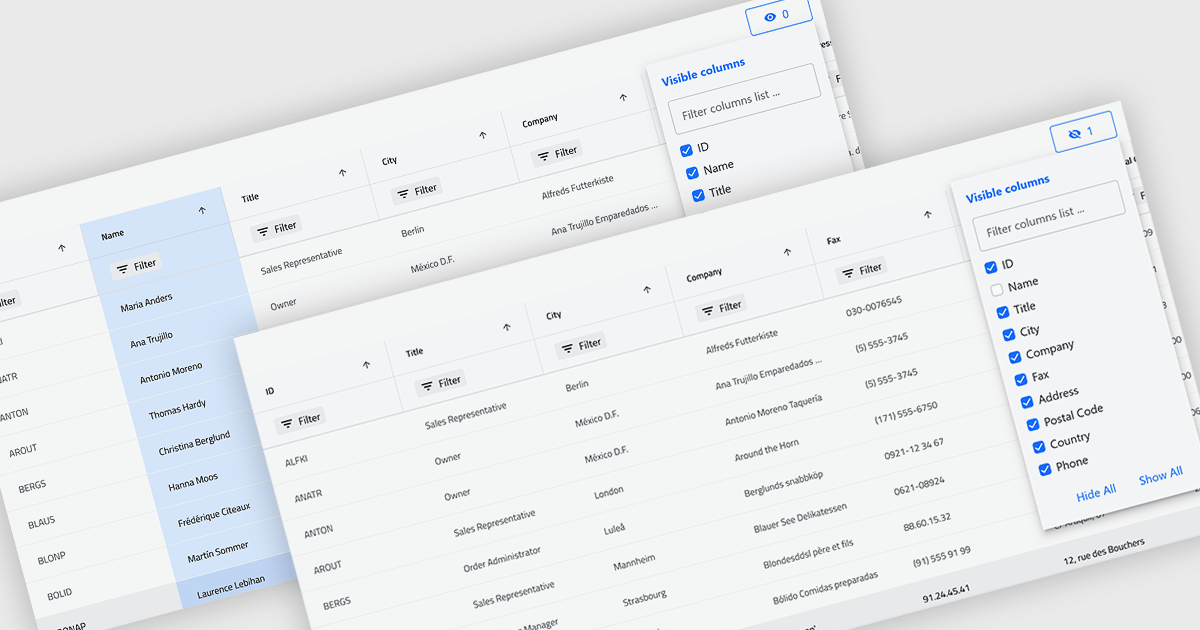
Column hiding in grids allows users to temporarily remove selected columns from view without deleting the underlying data. This provides a more focused and flexible way to work by showing only the fields relevant to a specific task or role. By reducing visual clutter and optimizing screen space, it improves readability and makes data easier to scan and analyze. For example, a financial analyst might display only revenue and profit columns for performance review, while a project manager may hide technical fields to focus on timelines and resources. Because columns can be restored at any time, the feature supports personalized, non-destructive customization.
Several .NET Blazor Grid controls offer the ability to hide columns including:
For an in-depth analysis of features and price, visit our .NET Blazor Grid controls comparison.


Tél : (888) 850 9911
Fax : +1 770 250 6199


