


Fournisseur officiel
Comme nous somme les distributeurs officiels et autorisés, nous vous fournissons des licences légitimes directement à partir de 200+ éditeurs de logiciels.
Voyez toutes nos marques.
Syncfusion Essential Studio Enterprise provides a comprehensive collection of UI components and frameworks for building modern cross-platform applications. It offers over 1,800 components compatible with .NET WinForms, WPF, ASP.NET Core & MVC, WinUI, MAUI, JavaScript, Xamarin, Blazor, and more, enabling seamless application development across diverse devices and operating systems.
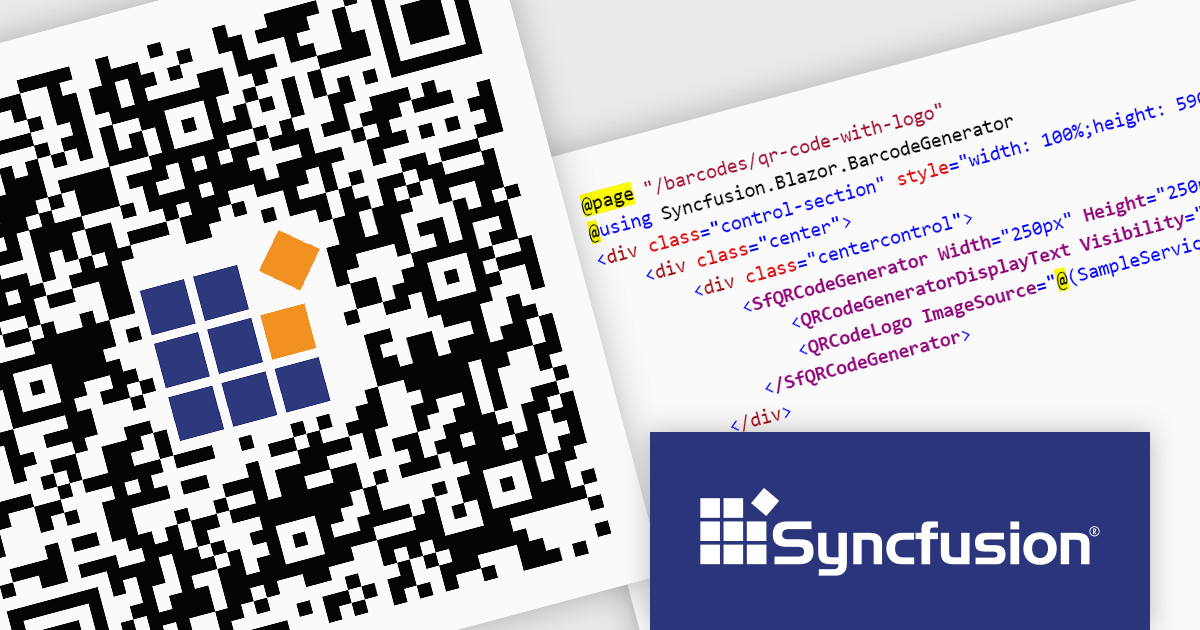
The Syncfusion Essential Studio Enterprise 2024 Volume 2 SP1 (26.2.4) release introduces the ability to embed a custom logo within generated QR codes, empowering businesses to enhance brand recognition and user engagement. By seamlessly integrating company branding into these ubiquitous codes, organizations can create a more distinctive and memorable user experience, fostering stronger brand recall and driving increased interaction with marketing materials and digital content.
To see a full list of what's new in 2024 Volume 2 SP1 (26.2.4), see our release notes for ASP.NET Core, ASP.NET MVC, Blazor, and JavaScript.
Syncfusion Essential Studio ASP.NET Core, ASP.NET MVC, Blazor and JavaScript are available as part of Syncfusion Essential Studio Enterprise which is licensed per developer starting with a Team License of up to five developers. It is available as a 12 Month Timed Subscription License which includes support and maintenance. See our Syncfusion Essential Studio Enterprise licensing page for full details.
Learn more on our ASP.NET Core, ASP.NET MVC, Blazor, and JavaScript product pages.
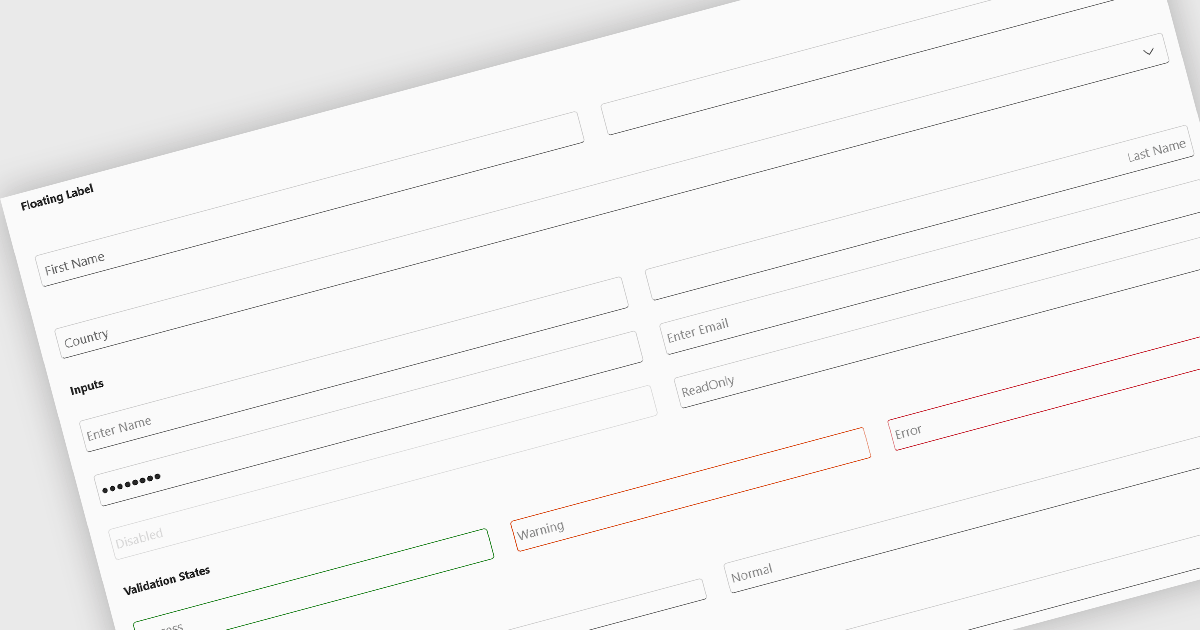
Text box components, also known as text fields, are essential elements allowing users to input and edit text within a user interface. They play a crucial role in forms and dialogs by facilitating data entry, improving user experience through clear labeling and validation, and ultimately enabling users to interact and provide information to the system.
Several Blazor data editor collections offer text box components including:
For an in-depth analysis of features and price, visit our Blazor data editors comparison.
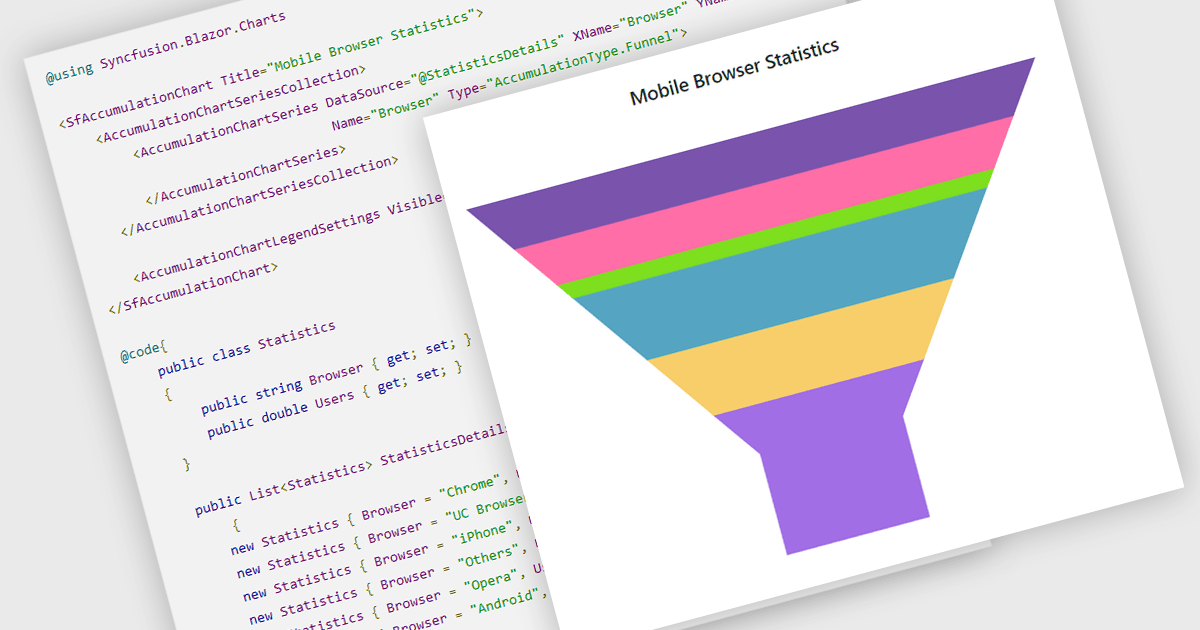
Funnel charts are a type of data visualization that depicts data in a linear process that often narrows down at each stage, resembling a funnel. They are especially useful for emphasizing steps in a process, displaying drop-off rates, and finding bottlenecks in workflows. Funnel charts are useful because they visually show the continual reduction of data throughout phases, providing clear insights into conversion rates and process efficiency. This enables engineers and business analysts to quickly find areas for improvement, optimize procedures, and create more accurate data-driven decisions.
Several .NET Blazor chart controls offer funnel charts including:
For an in-depth analysis of features and price, visit our .NET Blazor chart controls comparison.
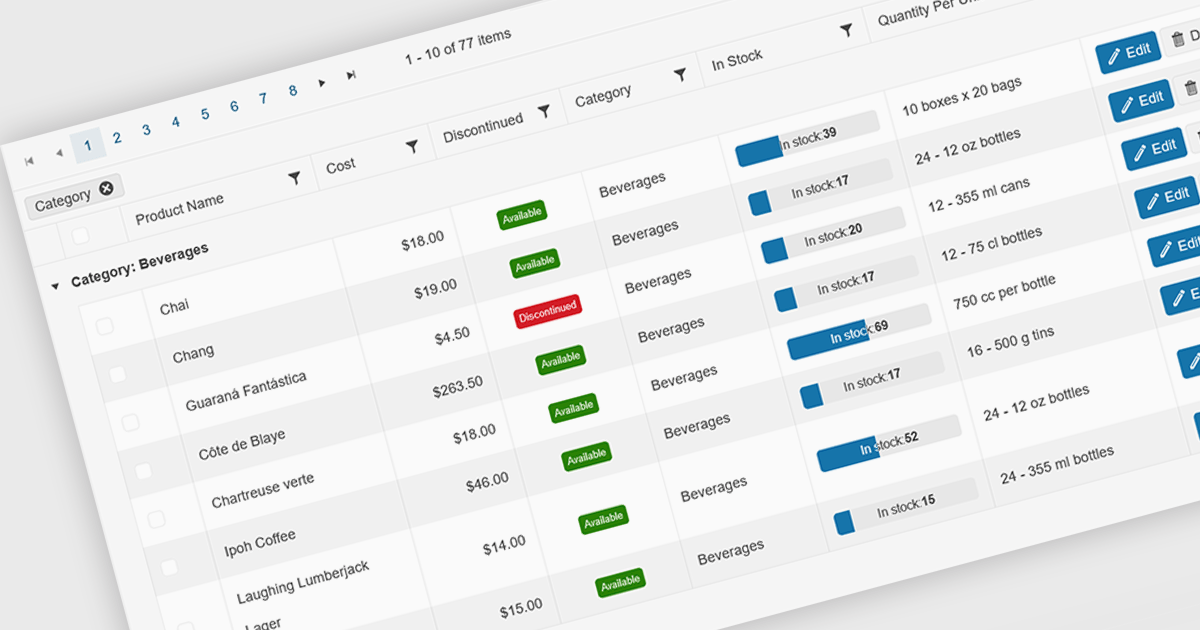
Grid paging is a user interface technique that divides large datasets into smaller, manageable pages within a grid or table. This significantly enhances performance by reducing the amount of data processed and displayed at once, improving load times and responsiveness, particularly when dealing with extensive datasets. Paging also enhances user experience by providing a clear structure for navigating through information, helping to prevent the user from being overwhelmed with excessive data.
Several Blazor grid controls offer paging support including:
For an in-depth analysis of features and price, visit our Blazor grid controls comparison.
In chart controls, show/hide series functionality empowers developers to dynamically control the visibility of individual data sets. This allows users to focus on specific series, enhancing data comprehension and analysis. By selectively hiding irrelevant series, developers can declutter the chart, making it easier for users to identify trends and patterns within the data of interest.
Several .NET Blazor chart controls offer show/hide series support including:
For an in-depth analysis of features and price, visit our .NET Blazor chart controls comparison.


Tél : (888) 850 9911
Fax : +1 770 250 6199


