








Fournisseur officiel
Comme nous somme les distributeurs officiels et autorisés, nous vous fournissons des licences légitimes directement à partir de 200+ éditeurs de logiciels.
Voyez toutes nos marques.
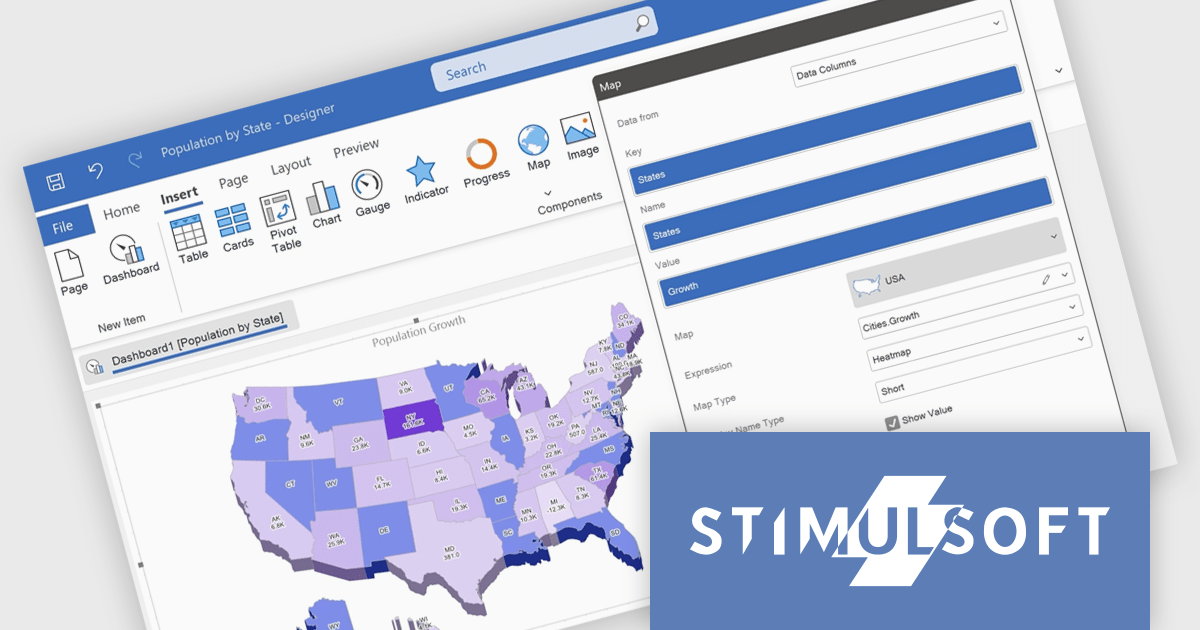
Stimulsoft Reports.WPF is a powerful reporting component for Windows Presentation Foundation (WPF) that provides rich rendering, viewing, printing, and exporting capabilities, allowing users to easily create, customize, and execute complex reports with minimal code, featuring a designer, data binding, WYSIWYG printing, and support for multiple export formats.
The Stimulsoft Reports.WPF 2024.4.1 release adds 3D support for maps in reports which allows for a more engaging and detailed visualization of geographic data. This feature can be easily turned on or off through the component editor or by using the Show 3D property, offering greater flexibility and making it easier to analyze spatial data with enhanced clarity.
To see a full list of what's new in 2024.4.1, see our release notes.
Stimulsoft Reports.WPF is licensed per developer and is available as a perpetual license with 1 year support and maintenance. See our Stimulsoft Reports.WPF licensing page for full details.
Stimulsoft Reports.WPF is available in the following products:
ComponentOne WPF Edition is a comprehensive suite of UI controls designed to accelerate the development of modern, visually appealing WPF applications. Offering a wide range of components, including grids, charts, input controls, and more, it empowers developers to create rich, interactive user interfaces with ease. By leveraging ComponentOne's advanced features and performance optimizations, businesses can deliver exceptional user experiences and gain a competitive edge.
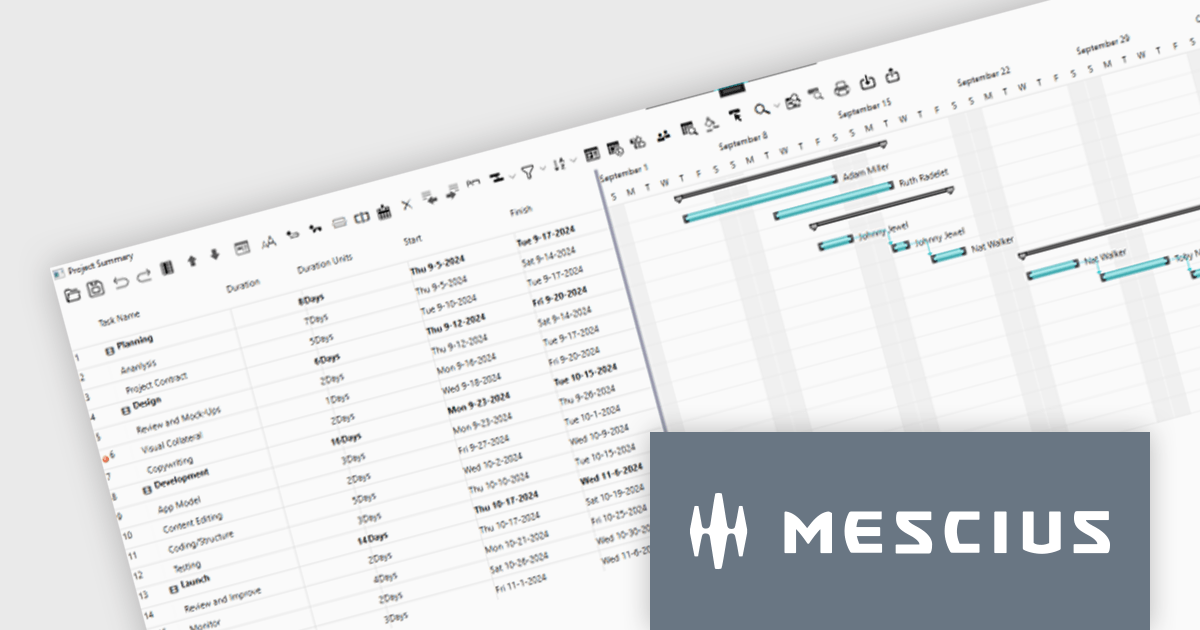
In this blog, MESCIUS Associate Software Engineer Nitin Sharma demonstrates how to use theC1GanttView control included in ComponentOne Studio WPF to provide a clear view of project timelines, task durations, dependencies, and resources. You will learn the steps involved to utilize the WPF Gantt View Control in Visual Studio, including:
Sample source code is included for each step.
Read the complete blog to get started leveraging the power of Gantt Charts in your WPF apps.
ComponentOne Studio WPF is licensed per developer on a perpetual basis and includes a 12 month subscription. See our ComponentOne Studio WPF licensing page for full details.
Learn more on our ComponentOne Studio WPF product page.
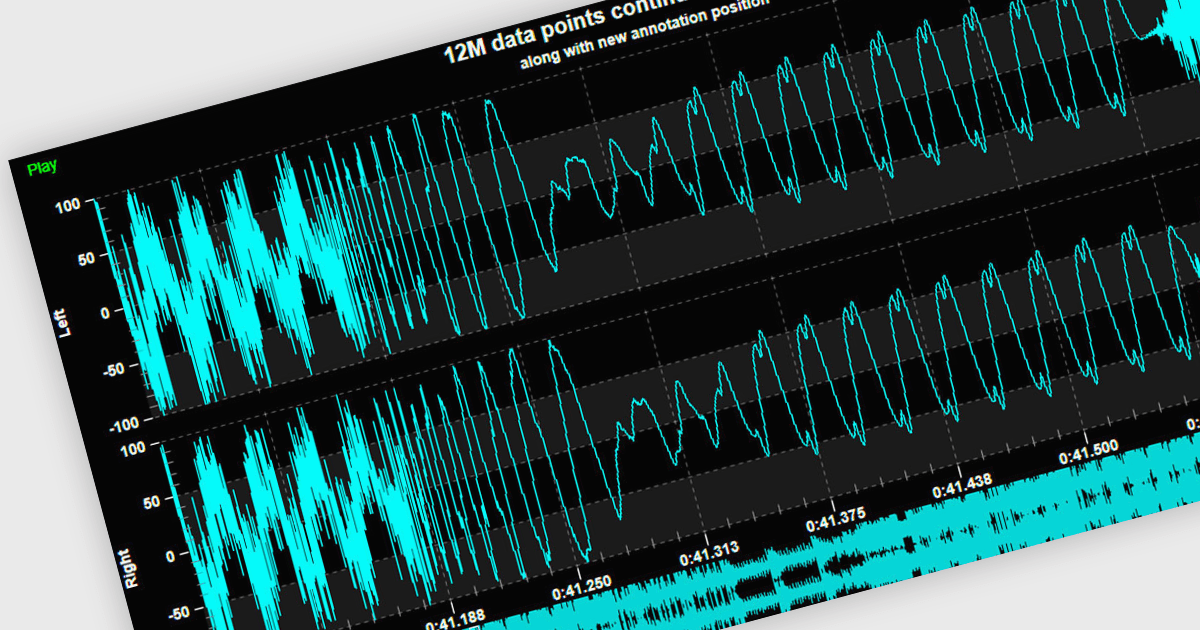
Live data support provides real-time updating of data points on a chart as new information becomes available, without the need for manual refresh or reloading. This feature allows developers to create responsive, interactive applications that can display dynamic data streams, such as financial market data, IoT sensor outputs, or real-time user metrics, directly within a chart interface. Live data enhances the user experience by providing immediate feedback and insight, improving decision-making and performance in applications that require constant data monitoring and analysis.
Several .NET 8 WPF chart controls support live data including:
For an in-depth analysis of features and price, visit our .NET 8 WPF chart controls comparison.
Spread.NET by MESCIUS is a powerful tool for building Excel-like applications in your .NET projects. It lets you create interactive spreadsheets, grids, dashboards, and even forms within WinForms, ASP.NET, and WPF applications. With its rich feature set, including a robust calculation engine, formula support, and Excel compatibility, Spread.NET empowers developers to build data analysis tools, budgeting apps, scientific dashboards, and more, all within the familiar .NET environment.
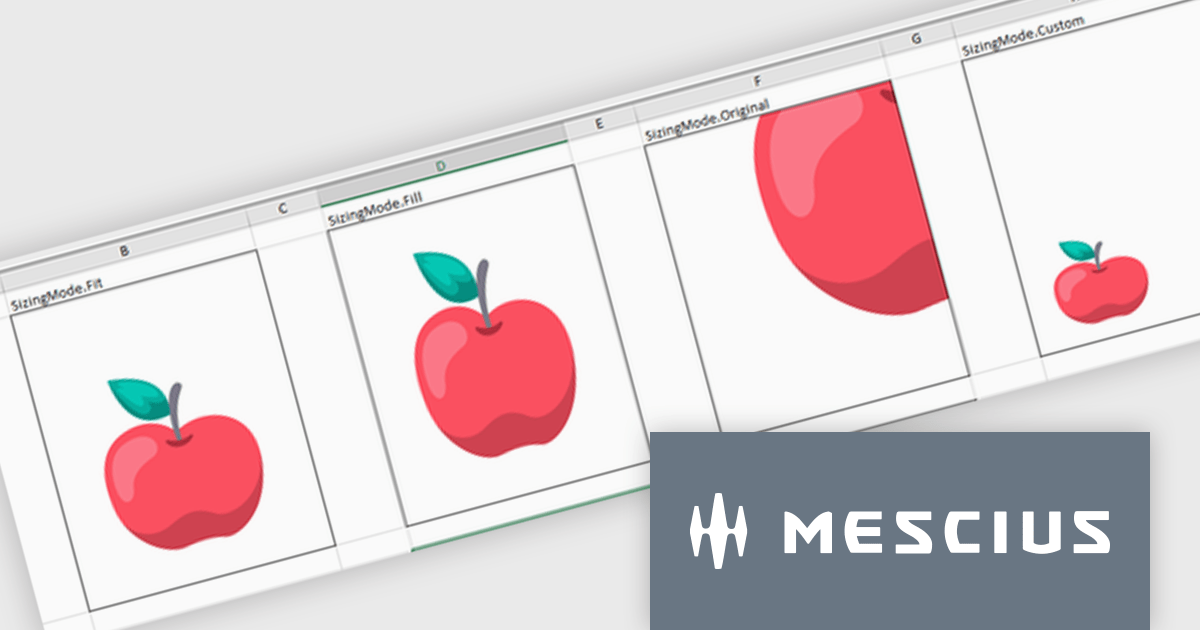
The Spread.NET v17.2 release introduces greater cell image versatility and customization. With four new distinct sizing options—Fit, Fill, Original, and Custom—users gain precise control over how images are displayed within cells. The Fit mode maintains the image's aspect ratio while ensuring it fits within the cell, preventing distortion. The Fill option covers the entire cell, disregarding the aspect ratio for full coverage. Original preserves the image's natural size, even if it exceeds the cell's dimensions, while Custom allows users to set specific height and width parameters. These flexible sizing options enhance the presentation of images, offering tailored solutions to fit various content needs, whether it’s for data visualization, design, or reporting purposes. This feature significantly improves visual control, ensuring consistency and a professional appearance across documents.
To see a full list of what's new in v17.2, see our release notes.
Spread.NET is licensed per developer and is available as a Perpetual License with a 12 month support and maintenance subscription. We can supply any Spread.NET license including new licenses, maintenance renewals, and upgrade licenses. See our Spread.NET licensing page for full details.
For more information, visit our Spread.NET product page.
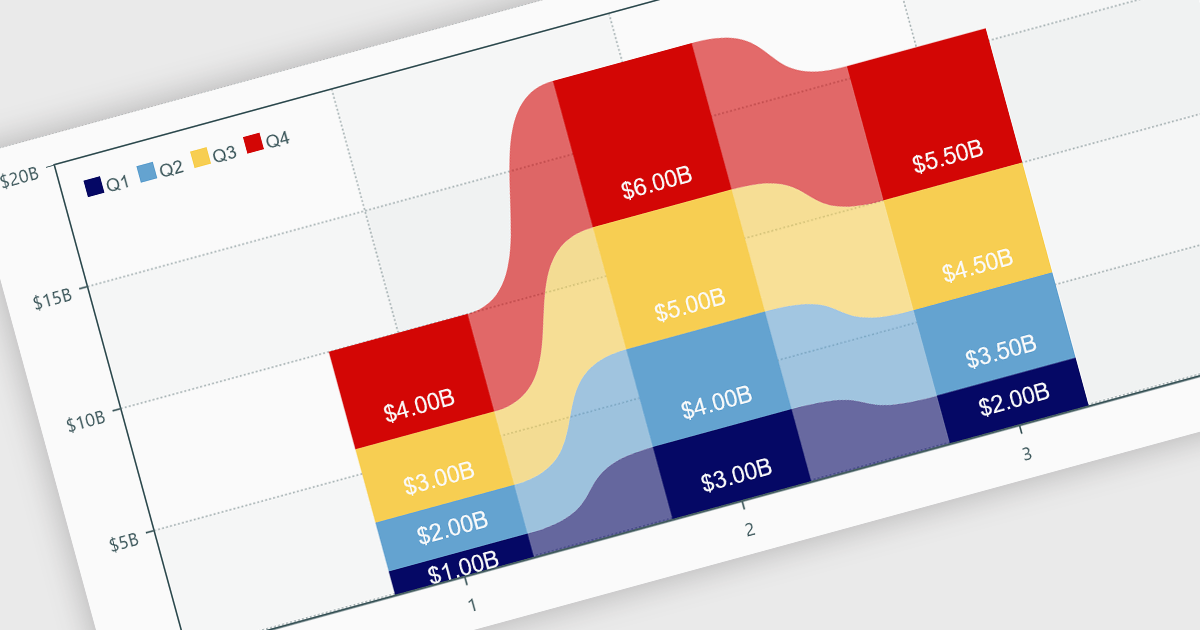
Charts within reports are graphical representations of data that allow users to visually interpret trends, comparisons, and patterns. They can take various forms, such as bar charts, line charts, or pie charts, and are typically integrated into dashboards or reporting tools to provide clear insights at a glance. By simplifying data visualization, charts enhance user experience and make it less taxing for users to understand complex information. Charts can be dynamically updated with real-time data, allowing for more responsive and insightful reporting in applications.
Several .NET WPF reporting controls offer support for charts including:
For an in-depth analysis of features and price, visit our comparison of .NET WPF Reporting controls.





Tél : (888) 850 9911
Fax : +1 770 250 6199


