


Fournisseur officiel
Comme nous somme les distributeurs officiels et autorisés, nous vous fournissons des licences légitimes directement à partir de 200+ éditeurs de logiciels.
Voyez toutes nos marques.
Telerik Reporting and Telerik Report Server deliver a complete solution for creating, managing, and distributing reports across .NET applications. Telerik Reporting is a lightweight, embedded reporting tool for .NET web and desktop apps. It lets developers and users easily design, customize, and export interactive, reusable reports. It supports multiple platforms, including ASP.NET Core, Blazor, MVC, AJAX, HTML5/JS, Angular, WPF, WinForms, and WinUI. Telerik Report Server is a web-based, server-side solution for centralized report management. Built on Telerik Reporting, it offers scheduling, delivery, user management, and web-based access. It can be used standalone or integrated into apps built with Blazor, Angular, or Windows Forms.
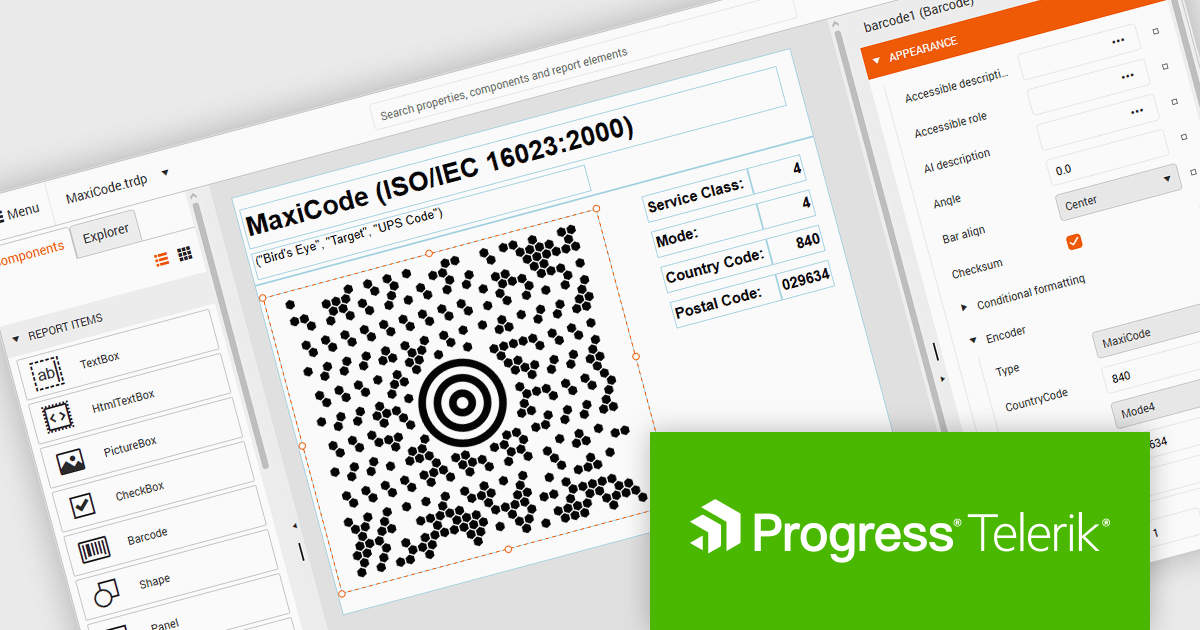
The Telerik Reporting and Report Server 2026 Q2 update adds MaxiCode barcode support, enabling developers to generate UPS-compatible shipping labels directly within Telerik reporting workflows without relying on separate labeling tools. The enhancement ensures accurate MaxiCode rendering across export formats including PDF, HTML, DOCX, XAML, Image, and RTF, while allowing barcode generation, scheduling, distribution, and reporting to be managed from a single platform. This helps organizations streamline shipping and fulfillment processes, automate high-volume delivery workflows through scheduled reports and data alerts, and reduce operational complexity.
To see a full list of what's new, see our release notes for Telerik Reporting and Telerik Report Server 2026 Q2.
Telerik Reporting is licensed per developer and is available as an Annual Subscription License, which includes product updates, technical support, AI Productivity Tools, and other benefits for 12 months. Telerik Report Server is licensed per domain, with each license including 15 Client Access Licenses (CALs) and 12 months of support and maintenance. See our licensing pages for full details. See our licensing pages for Telerik Reporting and Telerik Report Server for full details.
Telerik Reporting and Telerik Report Server are available individually or as part of Telerik DevCraft Ultimate.
Microsoft has announced the release of .NET 11 Preview 4. This Microsoft blog post highlights what's new in this release and includes links to download .NET 11 Preview 4. This .NET update contains improvements across the .NET Runtime, including:
Read the official Microsoft Release blog for a detailed list of all planned improvements in .NET 11.
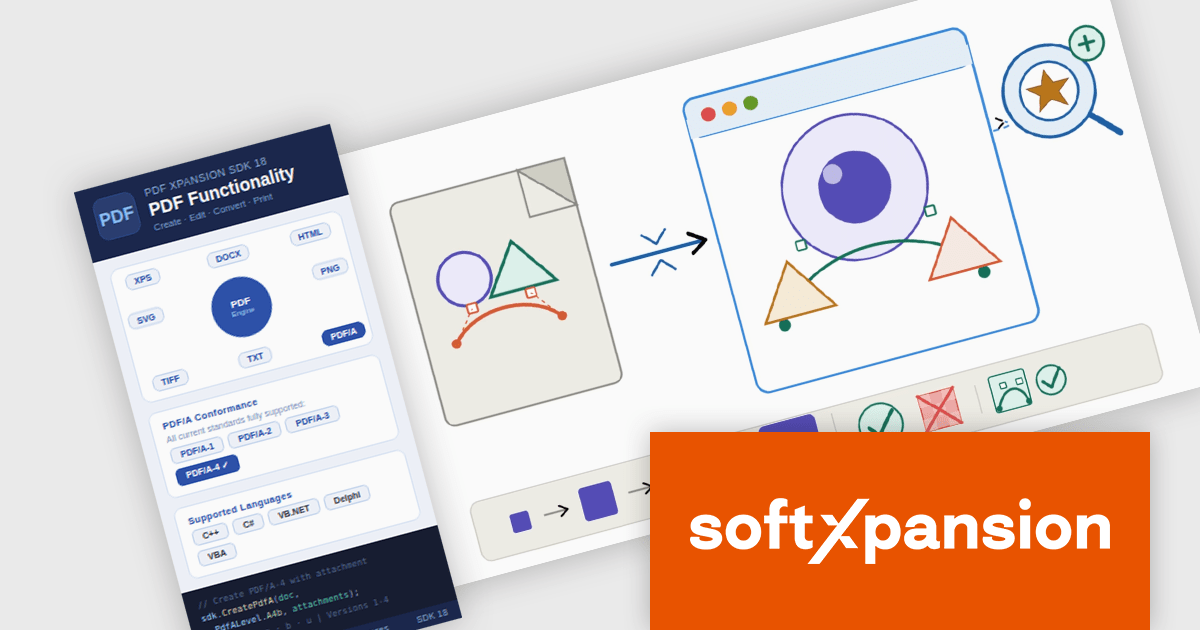
PDF Xpansion SDK by soft Xpansion is a modular software development kit for Windows applications that provides a broad set of APIs and components for creating, editing, viewing, converting, validating, and processing PDF, PDF/A, and XPS documents, alongside support for modern electronic invoicing standards such as XRechnung, ZUGFeRD, Factur-X, and EN 16931. The SDK includes specialized modules for PDF viewing, document combination and splitting, PDF/A compliance, and e-invoicing creation and receipt workflows, enabling developers to integrate document management, archiving, compliance, and business process functionality directly into desktop and enterprise applications. It also supports advanced capabilities such as PDF/UA accessibility, embedded XML data, document conversion, structured invoice validation, and customizable viewing interfaces, allowing developers to build solutions for document-centric workflows, digital archiving, regulatory compliance, document viewing, and automated invoice processing using a common set of PDF and e-invoicing development components.
The PDF Xpansion SDK 18.0.2 update introduces full SVG import capability, allowing developers to embed complete SVG files directly into PDF documents rather than being limited to basic SVG elements. This enhancement improves fidelity when working with vector graphics by preserving complex shapes, gradients, paths, and other advanced SVG features during PDF generation. As a result, applications can produce more accurate and visually consistent PDF output from modern SVG-based assets, reducing the need for graphic simplification, conversion workarounds, or manual adjustments while supporting a broader range of design and reporting scenarios. Note: This feature is not included in the license and requires an additional purchase - details and pricing available upon request.
To see a full list of what's new in 18.0.2, see our release notes.
PDF Xpansion SDK products are licensed on a per-location basis, with a separate license required for each company location where developers use the SDKs. An annual maintenance subscription is also available, providing product updates and 12 man-hours of support for one year. Optional add-ons are available, and certain features not included in the standard license may be licensed separately for an additional fee.
See the product license pages for full details:
Learn more about PDF Xpansion SDK on our product pages:
Spread.NET by MESCIUS is a tool for building Excel-like applications in your .NET projects. It lets you create interactive spreadsheets, grids, dashboards, and even forms within WinForms, ASP.NET, and WPF applications. With its rich feature set, including a robust calculation engine, formula support, and Excel compatibility, Spread.NET helps developers to build data analysis tools, budgeting apps, scientific dashboards, and more, all within the familiar .NET environment.
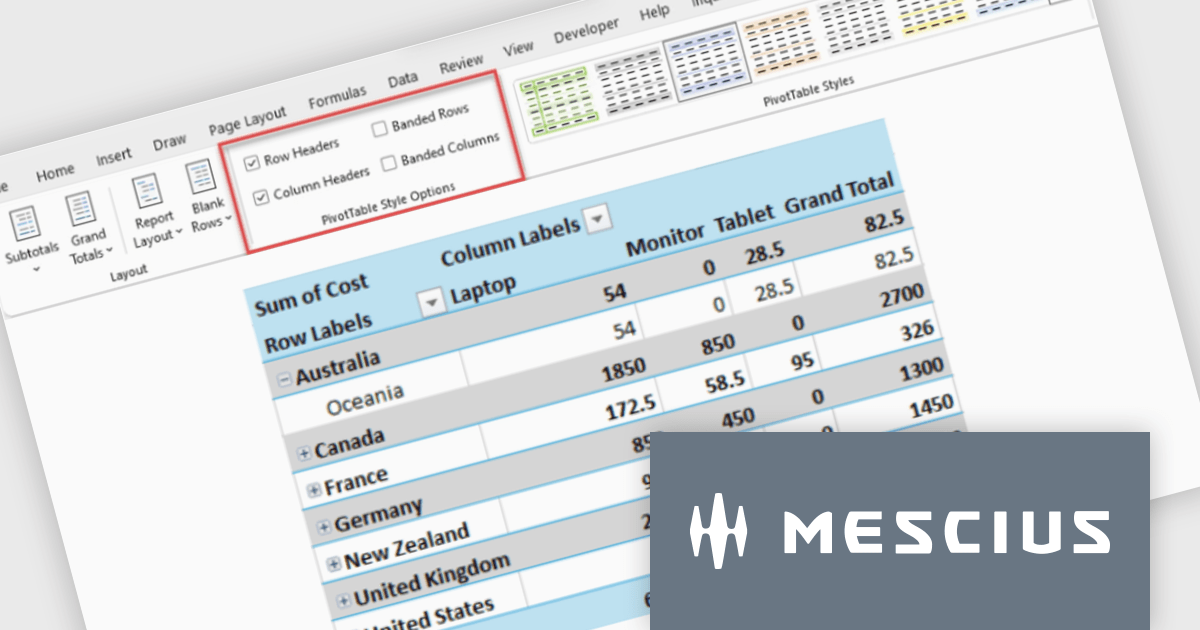
The Spread.NET v19.1 update introduces new Pivot Table style options that give developers greater control over the presentation of analytical data by enabling header styling customization and banded row and column formatting. These enhancements make Pivot Tables easier to read and navigate, helping users interpret large or complex datasets more efficiently while allowing applications to deliver more polished, professional reporting experiences with minimal development effort.
To see a full list of what's new in v19.1, see our release notes.
Spread.NET is licensed per developer and is available as a Perpetual License with a 12 month support and maintenance subscription. We can supply any Spread.NET license including new licenses, maintenance renewals, and upgrade licenses. See our Spread.NET licensing page for full details.
For more information, visit our Spread.NET product page.
DevCraft by Telerik is a comprehensive suite of more than 1,250 UI components and development tools designed for building modern web, desktop, and mobile applications using .NET and JavaScript frameworks. It includes reporting and report management solutions, automated testing and mocking tools, and document processing libraries, as well as a wide range of professionally designed user interface controls from the Telerik and Kendo UI suites. DevCraft enables developers to create feature-rich, high-performance applications with consistent design and user experience, delivering enterprise-level, scalable, and maintainable software solutions.
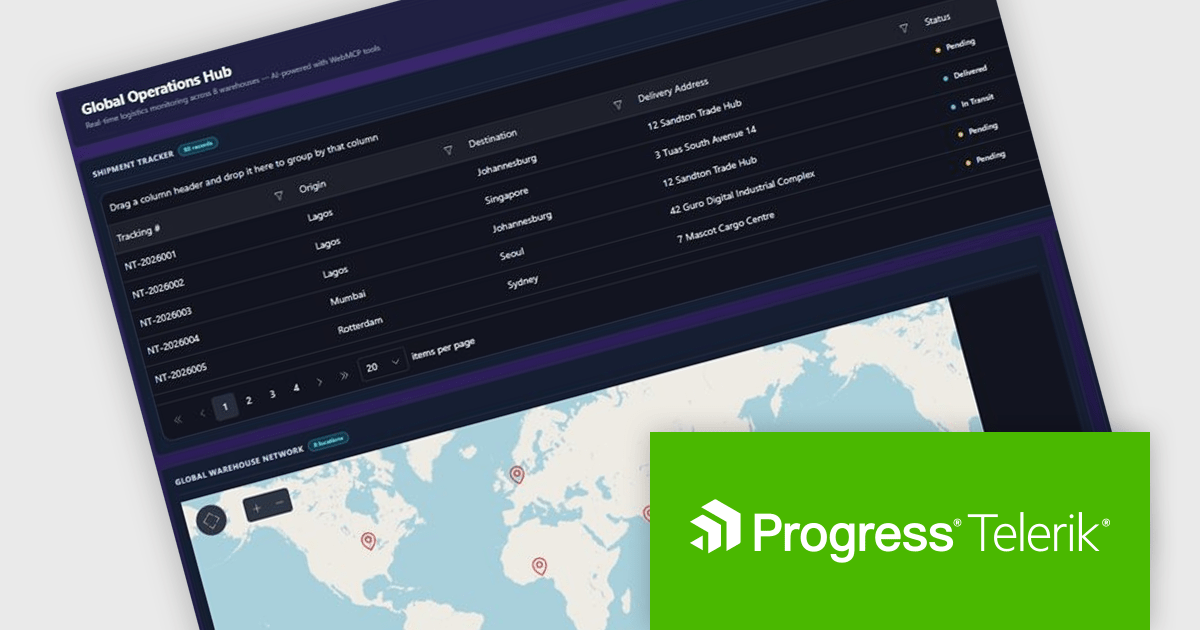
The Telerik DevCraft 2026 Q2 update introduces WebMCP integration as a preview feature, enabling developers to explore applications that work directly with AI agents through structured interactions. By exposing application functionality as actionable tools, it allows AI agents to perform tasks such as filtering data, navigating views, and updating values without relying on DOM scraping or simulated user actions. This preview helps developers evaluate more reliable AI driven workflows, simplify the implementation of intelligent application experiences, and prepare their applications for emerging AI standards and use cases.
To see a full list of what's new in DevCraft 2026 Q2, see our release notes.
Telerik DevCraft is licensed per developer and has two licensing models: an annual Subscription License and a Perpetual License. The Subscription license provides access to the latest product updates, technical support, and exclusive benefits for a flat annual fee, and must be renewed to continue using the software. The Perpetual license is a one-time purchase granting access to the current released version and includes one-year Maintenance and Support. After this initial period, users can choose to renew Maintenance & Support to continue receiving updates and support; otherwise, they may continue using the installed version available during their active maintenance period but will forgo future updates and support. See our Telerik DevCraft Ultimate licensing page for full details.
For more information, see our product pages:


Tél : (888) 850 9911
Fax : +1 770 250 6199


