








Fournisseur officiel
Comme nous somme les distributeurs officiels et autorisés, nous vous fournissons des licences légitimes directement à partir de 200+ éditeurs de logiciels.
Voyez toutes nos marques.
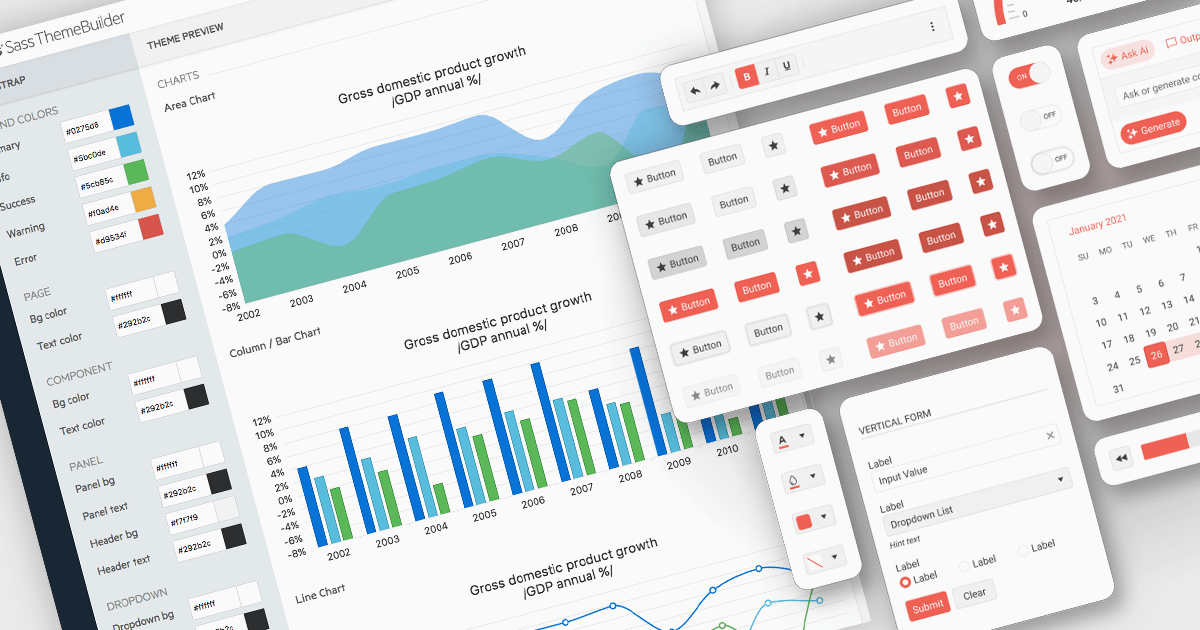
UI theming is the process of defining and applying a consistent visual style across a user interface using centralized settings for elements like colors, typography, spacing, and component styles. It allows developers to create cohesive designs that align with branding requirements, ensure cross-platform consistency, and adapt easily to user preferences or accessibility needs. By leveraging theming, software developers can streamline development workflows, reduce redundancy, and simplify maintenance while delivering customizable, scalable, and user-friendly applications.
Several React UI suites offer theming support, including:
For an in-depth analysis of features and price, visit our comparison of React UI suites.
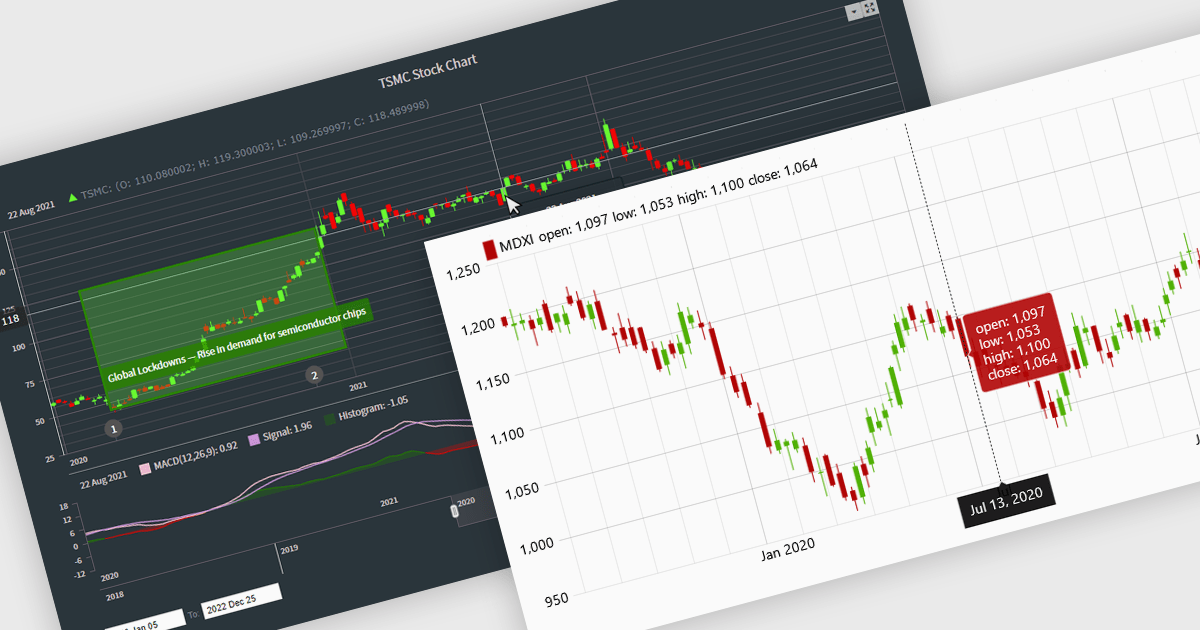
Candlestick charts are a powerful data visualization tool used to represent price movements within a specific time frame, displaying the opening, closing, high, and low prices in a single, compact graphical format. For software developers, integrating candlestick charts into applications enables users to analyze market trends, identify potential reversals, and make informed decisions with precise, actionable data. These charts are adaptable across various time frames, work seamlessly with technical indicators, and offer a clear visual representation that aids in interpreting complex financial data efficiently, making them an essential feature in trading platforms and analytics tools.
Several React chart controls offer candlestick chart support including:
For an in-depth analysis of features and price, visit our React chart controls comparison.
PDF viewer components with PDF reading and writing capabilities can greatly enhance modern web applications, enabling seamless interaction with documents directly within the browser. These components commonly allow users to view, edit, annotate, and export PDF files without relying on external software, streamlining document management. By leveraging the power of web technologies, they offer a versatile and efficient solution for integrating PDF workflows into web applications, enhancing productivity and improving the user experience in industries where PDF handling is critical.
Common features include:
For an in-depth analysis of features and price, visit our JavaScript / HTML5 PDF Viewer components comparison.
Stimulsoft Dashboards.JS is a JavaScript-based tool for creating interactive dashboards within web applications. Designed for developers and businesses, it provides customizable charts, graphs, and tables to visualize complex data from various sources. It supports popular JavaScript frameworks such as React, Vue.js, and Node.js, enabling seamless integration into modern web projects. With an intuitive interface and responsive design, it suits use cases like business intelligence, performance monitoring, and data-driven decision-making. Stimulsoft Dashboards.JS enhances user engagement and simplifies data analysis for industries such as finance, marketing, and logistics.
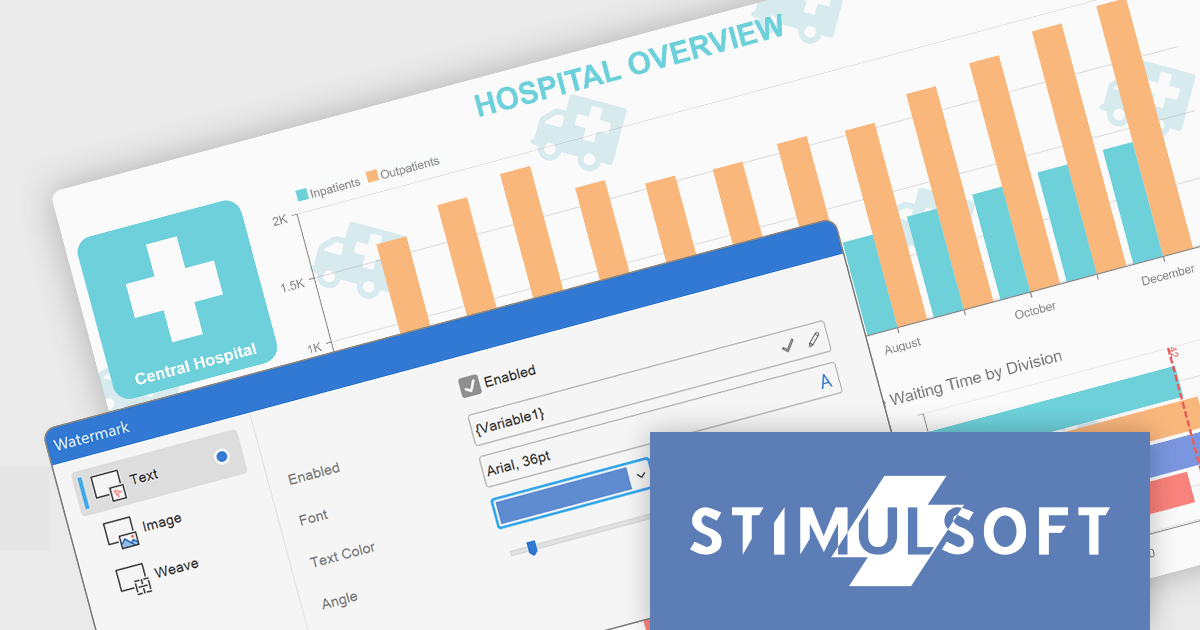
The Stimulsoft Dashboards.JS 2025.1.1 update introduces the ability to use expressions in dashboard watermarks, providing developers with enhanced flexibility to create dynamic and context-aware visual elements. This feature allows watermarks to adapt based on data or user-defined expressions, enabling the seamless integration of real-time information, branding, or contextual details directly into dashboards. By supporting Text, Image, Weave, and combined elements, the update streamlines customization and ensures that watermarks can align with specific design or functional requirements, helping developers deliver more polished and responsive dashboards.
To see a full list of what's new in 2025.1.1, see our release notes.
Stimulsoft Dashboards.JS is licensed per developer and is available as a Perpetual license with 1 year support and maintenance. See our Stimulsoft Dashboards.JS licensing page for full details.
Stimulsoft Dashboards.JS is available individually or as part of Stimulsoft Ultimate.

PDF annotations in PDF Viewer components allow users to interact with and mark up documents directly within an application. This functionality is critical for workflows requiring collaborative review, document editing, or enhanced personalization of PDFs, offering a seamless experience for annotating without requiring external tools. By embedding annotation capabilities, applications can boost productivity and streamline document-centric tasks.
Common features include:
For an in-depth analysis of features and price, visit our React PDF Viewer components comparison.





Tél : (888) 850 9911
Fax : +1 770 250 6199


