


Fournisseur officiel
Comme nous somme les distributeurs officiels et autorisés, nous vous fournissons des licences légitimes directement à partir de 200+ éditeurs de logiciels.
Voyez toutes nos marques.
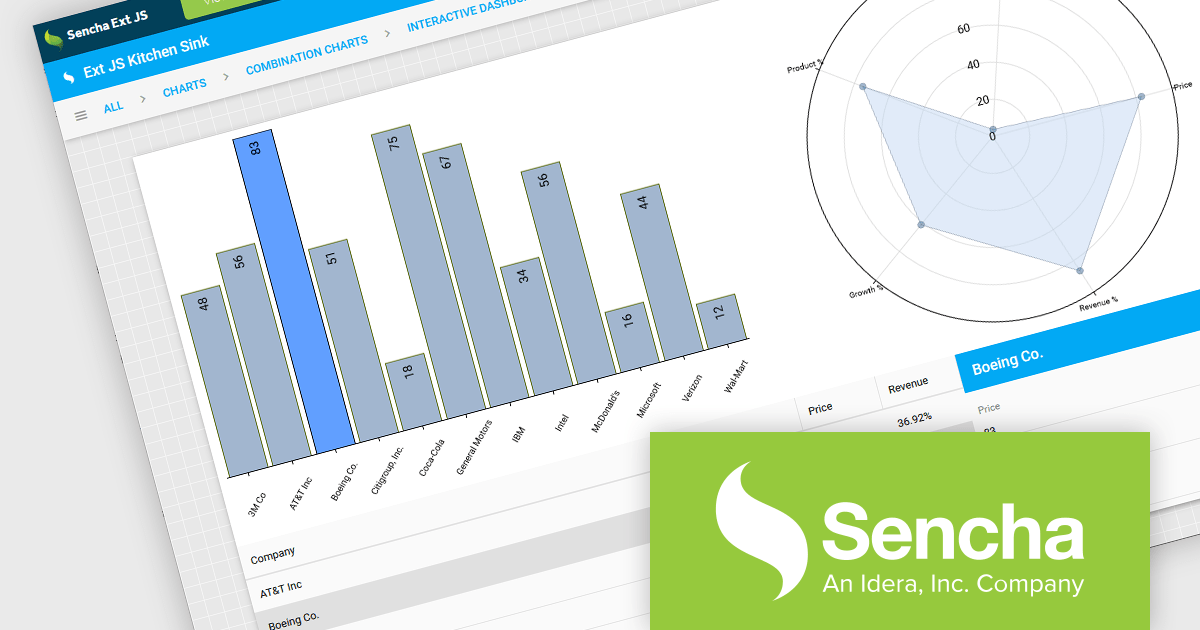
Sencha Ext JS is a comprehensive JavaScript framework for building robust, data-intensive web applications. It offers a rich library of pre-built UI components, advanced data management capabilities, and tools for efficient development and testing, enabling rapid creation of cross-platform applications with high performance and a polished user experience.
ReExt is a library that seamlessly integrates Sencha Ext JS high-performance UI components into React applications. It provides a bridge between the two frameworks, allowing developers to leverage the rich feature set of Ext JS for building complex user interfaces while maintaining a React-based development workflow, accelerating development and enhancing application capabilities. ReExt enables developers to build powerful, data-driven applications by combining the flexibility and simplicity of React with the robust, feature-rich components of Ext JS.
To utilize ReExt you will need a Sencha Ext JS License, available in Pro, Enterprise and Ultimate editions, as Annual Subscription or Perpetual Licenses. See our Sencha Ext JS licensing page for full details.
For more information, see our Sencha Ext JS product page.
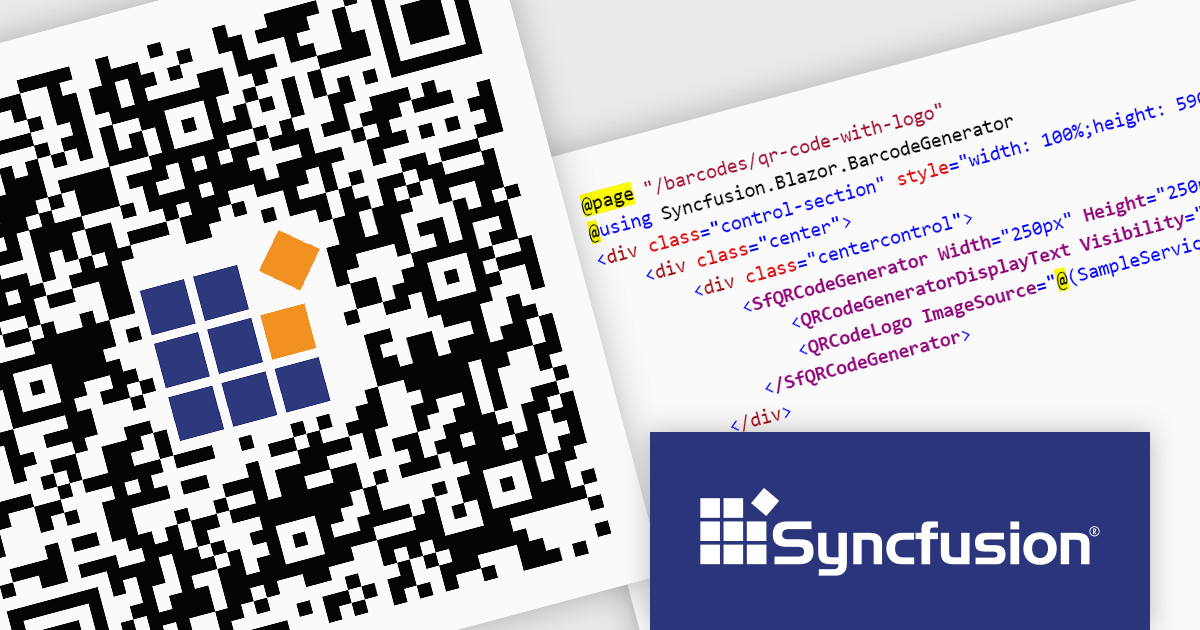
Syncfusion Essential Studio Enterprise provides a comprehensive collection of UI components and frameworks for building modern cross-platform applications. It offers over 1,800 components compatible with .NET WinForms, WPF, ASP.NET Core & MVC, WinUI, MAUI, JavaScript, Xamarin, Blazor, and more, enabling seamless application development across diverse devices and operating systems.
The Syncfusion Essential Studio Enterprise 2024 Volume 2 SP1 (26.2.4) release introduces the ability to embed a custom logo within generated QR codes, empowering businesses to enhance brand recognition and user engagement. By seamlessly integrating company branding into these ubiquitous codes, organizations can create a more distinctive and memorable user experience, fostering stronger brand recall and driving increased interaction with marketing materials and digital content.
To see a full list of what's new in 2024 Volume 2 SP1 (26.2.4), see our release notes for ASP.NET Core, ASP.NET MVC, Blazor, and JavaScript.
Syncfusion Essential Studio ASP.NET Core, ASP.NET MVC, Blazor and JavaScript are available as part of Syncfusion Essential Studio Enterprise which is licensed per developer starting with a Team License of up to five developers. It is available as a 12 Month Timed Subscription License which includes support and maintenance. See our Syncfusion Essential Studio Enterprise licensing page for full details.
Learn more on our ASP.NET Core, ASP.NET MVC, Blazor, and JavaScript product pages.
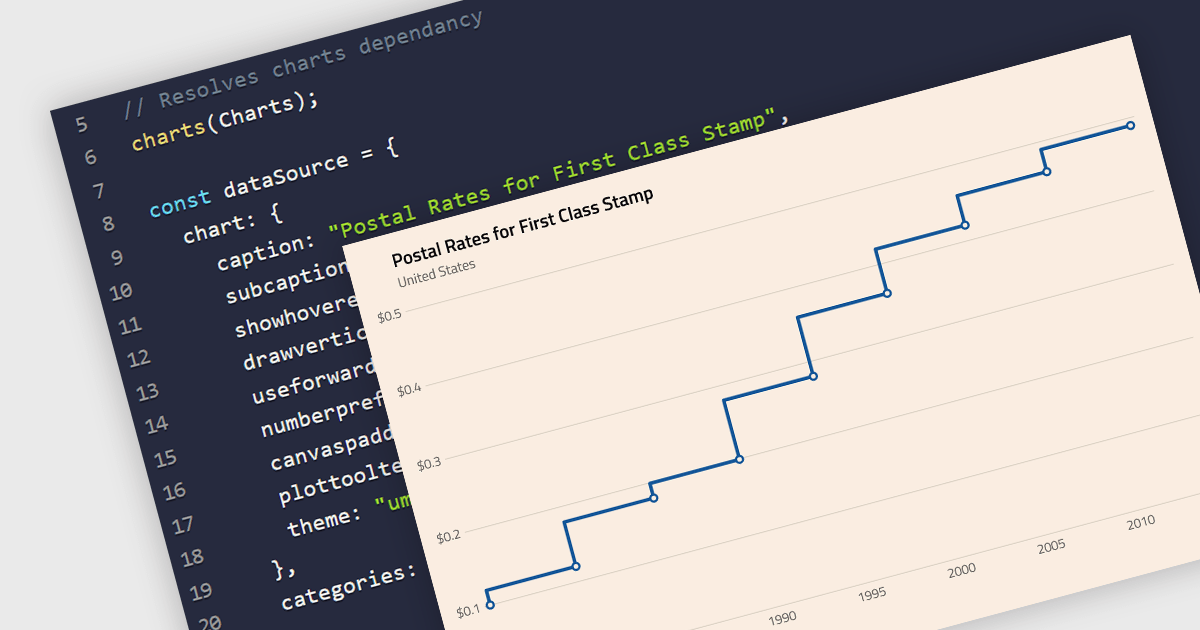
A step line chart is a type of data visualization that displays data points connected by horizontal and vertical line segments, forming a step-like appearance. Unlike traditional line charts that emphasize continuous trends, step line charts highlight changes that occur at irregular intervals and are for depicting data that changes at specific points in time. This makes them particularly effective for representing data that undergoes discrete shifts, such as inventory levels, interest rates, or monitoring server performance, where the exact timing and magnitude of changes are crucial to understand. By clearly showing these transitions, these charts provide precise insights into the timing and impact of changes, aiding in more accurate decision-making and analysis.
Several React chart components support the step line chart type, including:
For an in-depth analysis of features and price, visit our comparison of React chart components.
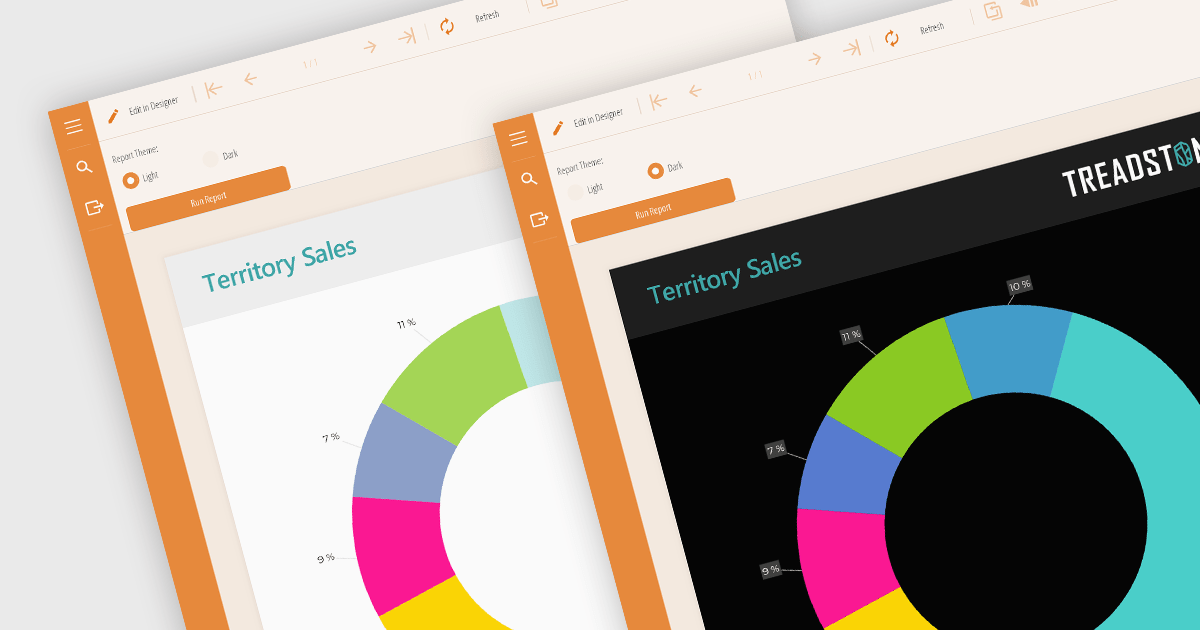
Reporting component themes provide a consistent visual style and branding across complex data visualizations. By offering pre-defined color palettes, typography, and layout options, themes streamline the design process and ensure reports align with overall application aesthetics. They enable rapid customization, allowing developers to create multiple themes for different report types or user preferences. Additionally, themes enhance user experience by improving readability and data perception, making complex information easier to understand. Use cases include creating branded reports, adapting to different screen sizes, and matching the look and feel of existing applications.
Several React reporting controls offer support for themes including:
For an in-depth analysis of features and price, visit our React reporting controls comparison.
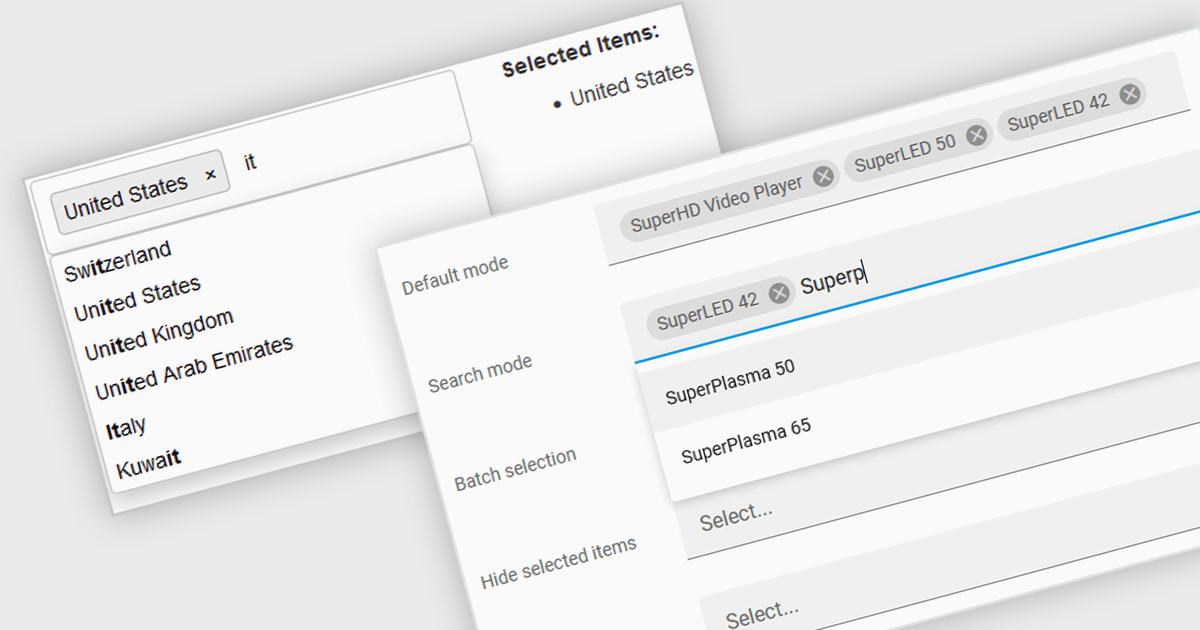
Token boxes, also known as token input controls, are user interface elements designed to streamline data entry for multiple values. They allow users to input, manage, and manipulate discrete pieces of data (tokens) within a single form field. This enhances user experience by facilitating tagging, categorization, and selection of multiple items, while providing developers with a robust tool for intuitive interfaces. The benefits include improved clarity through visual separation of values, efficient data handling, and ease of use in applications like search filters, email address inputs, and tagging systems.
Many React data editor collections contain token box / input controls including:
For an in-depth analysis of features and price, visit our comparison of React Data Editors.


Tél : (888) 850 9911
Fax : +1 770 250 6199


