


Fournisseur officiel
Comme nous somme les distributeurs officiels et autorisés, nous vous fournissons des licences légitimes directement à partir de 200+ éditeurs de logiciels.
Voyez toutes nos marques.
DevExpress VCL Subscription is a comprehensive suite for Delphi and C++ Builder developers that includes high-performance UI components, reporting tools, data visualization elements, and application templates. It lets you build rich, data-driven business applications with ease, offering ongoing updates, technical support, and royalty-free distribution rights, perfect for boosting developer productivity and delivering polished software experiences.
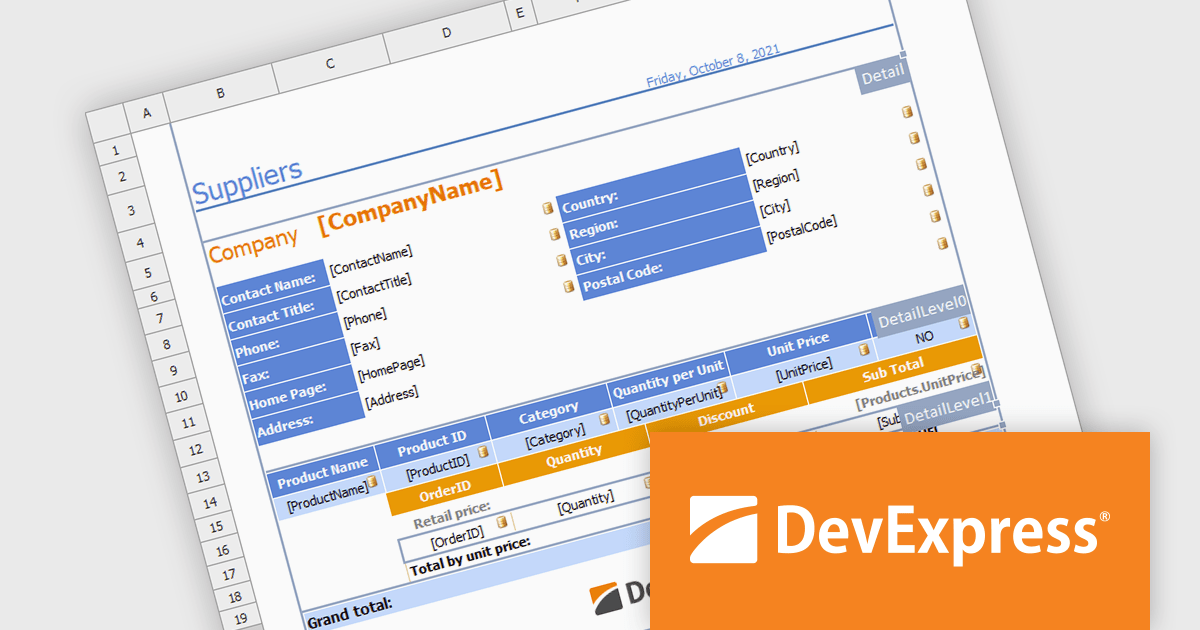
The DevExpress VCL spreadsheet report designer enables users to create dynamic, data-aware reports by binding data from simple datasets or master-detail tables to customizable spreadsheet templates. It automates data population, ensuring accuracy and efficiency in generating professional reports for use cases such as financial summaries, inventory management, and customer analytics. This feature simplifies complex reporting needs while delivering flexibility and precision, making it an essential tool for data-driven applications. The Report Designer is ideal for creating data-driven reports, making it perfect for financial reporting, inventory tracking, sales analytics, and any scenario requiring automated, accurate data presentation within professional templates.
DevExpress VCL Subscription is licensed per developer and is available as a Perpetual License with a 12 month support and maintenance subscription. See our DevExpress VCL Subscription licensing page for full details.
For more information, visit our DevExpress VCL Subscription product page.

Undo and redo functionality in a spreadsheet allows users to reverse or reapply actions made during editing, providing a straightforward way to correct mistakes or recover changes. The undo option enables users to step back through recent actions, such as data entry, formatting, or formula adjustments, while redo restores any actions reversed by the undo function. This capability provides a safety net, allowing users to recover from unintended modifications, thereby enhancing productivity as it minimizes errors and streamlines the editing process.
Several WPF spreadsheet components allow you to redo and undo editing changes, including:
For an in-depth analysis of features and price, visit our WPF spreadsheet controls comparison.
TSplus Advanced Security is a comprehensive cybersecurity solution designed to protect application servers and remote desktops from cyber threats like malware, botnets, and online attacks. Featuring Hacker IP Protection, it uses community-driven intelligence to maintain a daily updated blacklist of verified malicious IPs, ensuring accurate and reliable defense. Seamlessly integrating with firewalls, it blocks unauthorized access and prevents disruptions caused by false positives. With automatic updates and one-click manual refresh options, it offers effortless protection. Ideal for IT administrators and businesses, TSplus Advanced Security ensures secure, uninterrupted operations and a safer remote work environment.
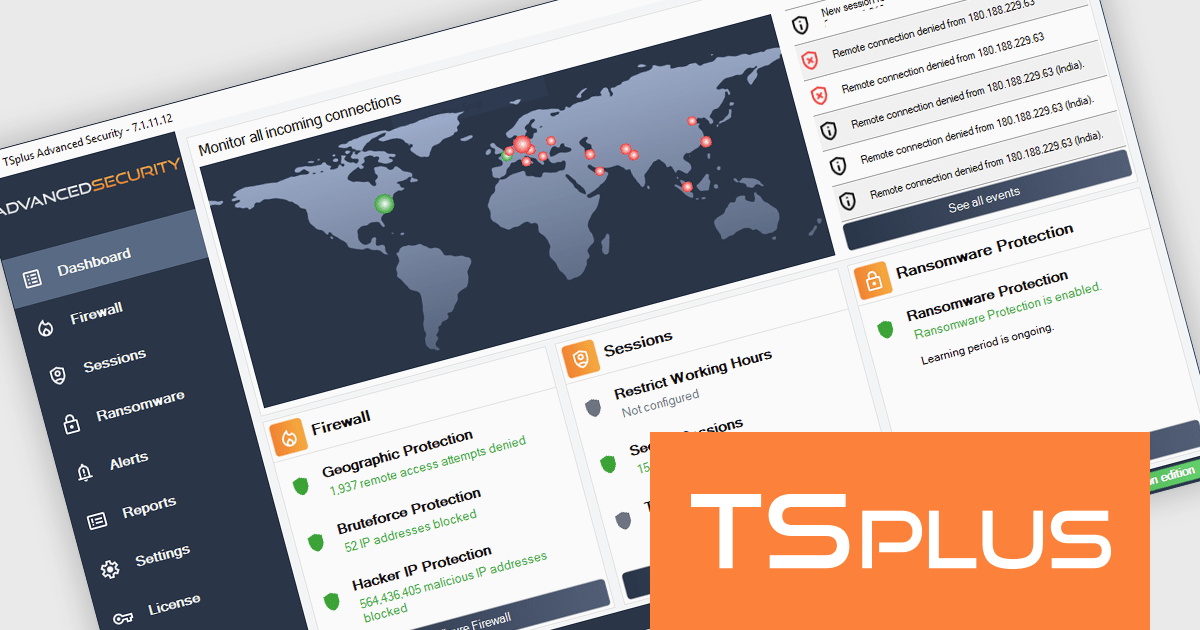
The TSplus Advanced Security V7.1 update introduces a Real-Time Threat Dashboard designed to provide software developers with immediate, actionable insights into potential security risks. By integrating a global map that visualizes the origins of attacks and displaying data from the last 100 failed connection attempts, this feature streamlines the process of identifying and analyzing threats. Developers can quickly assess vulnerabilities and take targeted actions to enhance system security, ensuring a more robust defense against unauthorized access and potential breaches. This update prioritizes efficiency and clarity, making threat management more effective and accessible.
To see a full list of what’s new in version 7.1, see our release notes.
TSplus Advanced Security is licensed per server, and is available in Essentials and Ultimate editions as a perpetual license with 1 year of updates and support. See our TSplus Advanced Security licensing page for full details.
For more information, visit our TSplus Advanced Security product page.
DataGrip is a multi-engine database environment that supports MySQL, PostgreSQL, Microsoft SQL Server, Oracle, Sybase, DB2, SQLite, HyperSQL, Apache Derby and H2. It includes an editor that provides intelligent coding assistance such as auto-completion, analysis and navigation. It also features a query console for running and profiling queries.
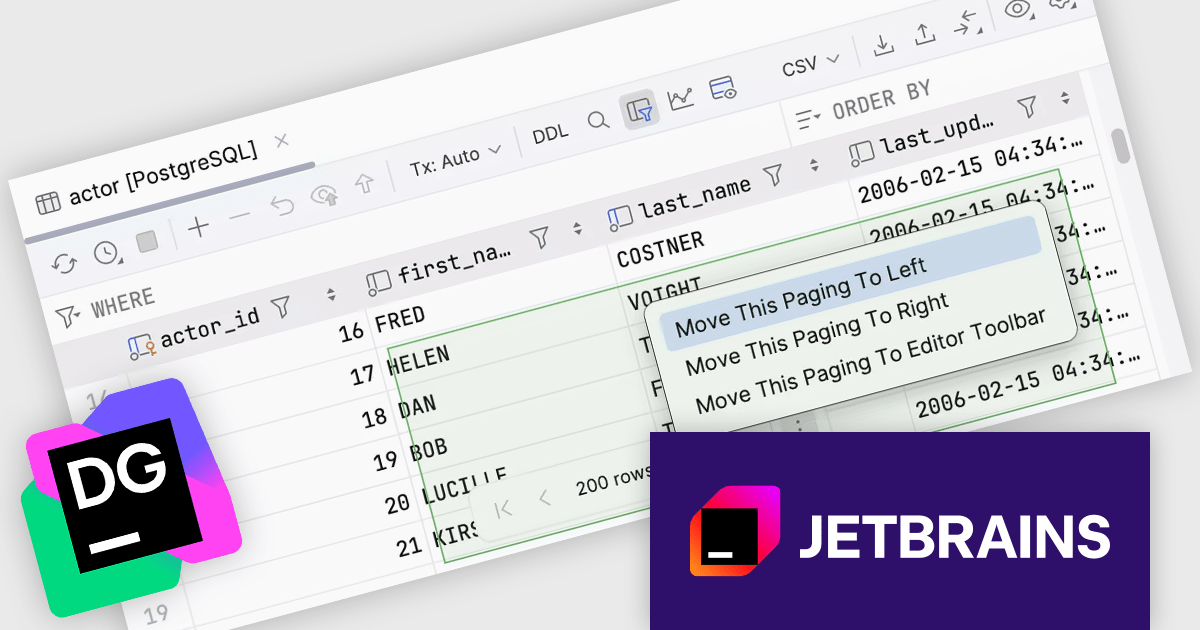
The JetBrains DataGrip 2024.3 release introduces a floating pagination toolbar, enhancing data navigation by repositioning the pagination controls to the bottom center of the data editor, making grid paging more visible and intuitive. This update improves workflow efficiency, especially when working with large datasets, by providing quick and centralized access to pagination. For users preferring traditional layouts, the control remains customizable, allowing it to be moved back to the toolbar through the IDE's settings. Ideal for database professionals who frequently manage extensive data grids, this feature ensures greater flexibility and a smoother user experience tailored to individual preferences.
To see a full list of what's new in version 2024.3, see our release notes.
DataGrip is licensed per user, and is available as a commercial annual subscription license. We can supply new subscriptions, subscription renewals (including continuity discounts), lapsed renewals, and additional user licenses. See our DataGrip licensing page for full details.
DataGrip is available to buy in the following products:
Skyvia Connect is a cloud-based integration platform that enables developers to connect and synchronize data between various applications and databases. It offers a flexible and scalable solution for building data pipelines and automating data workflows, supporting a wide range of data sources and formats. By providing a user-friendly interface and pre-built connectors, Skyvia Connect simplifies the process of integrating data systems, allowing developers to focus on core application development and data management tasks.
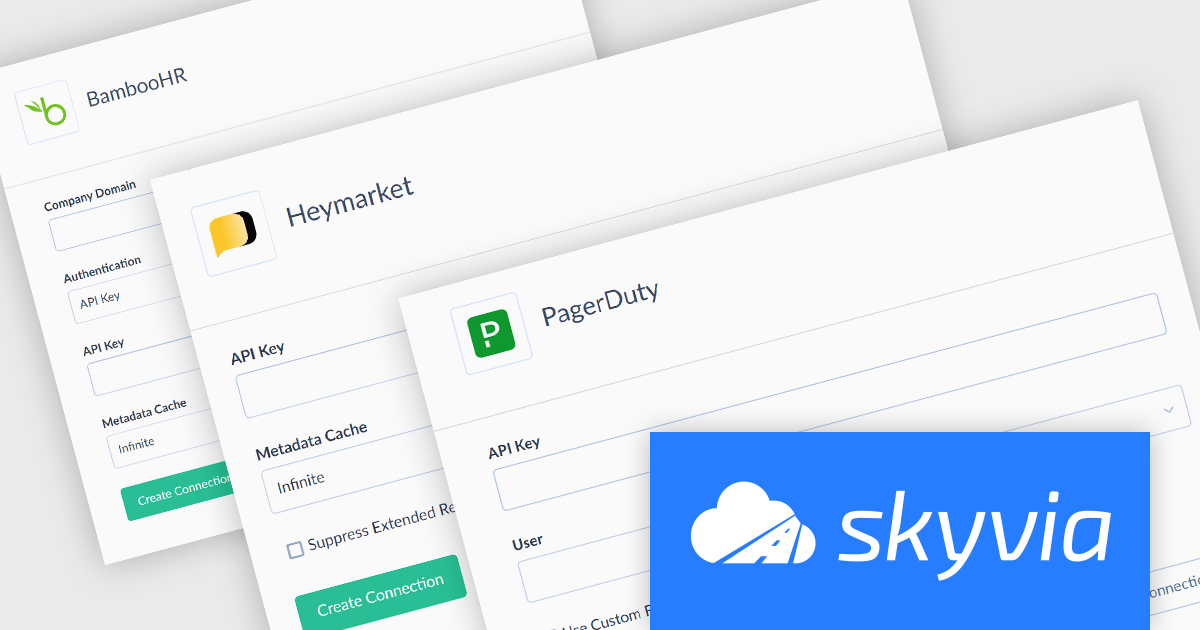
The latest release of Skyvia Connect adds new connectors for BambooHR, Heymarket, and PagerDuty. This enhancement enables seamless data integration for a broader range of business applications. These connectors cater to critical operational domains: BambooHR supports streamlined HR and employee data management, Heymarket enhances communication workflows through SMS and messaging, and PagerDuty improves incident management and operational reliability.
By integrating these tools, Skyvia Connect enables organizations to automate workflows, enhance collaboration, and derive actionable insights from interconnected systems, ultimately boosting productivity and decision-making across HR, communication, and IT operations.
To see a full list of what's new, see our release notes.
Skyvia Connect is licensed based on volume of traffic per month and is available as an Annual License. See our Skyvia Connect licensing page for full details.
Learn more on our Skyvia Connect product page.


Tél : (888) 850 9911
Fax : +1 770 250 6199


