








Fournisseur officiel
Comme nous somme les distributeurs officiels et autorisés, nous vous fournissons des licences légitimes directement à partir de 200+ éditeurs de logiciels.
Voyez toutes nos marques.
Stimulsoft BI Server is a comprehensive client-server Business Intelligence solution designed for reporting and analytics. The front end offers powerful data visualization capabilities, while the back end handles data processing and storage. It can function as a standalone report server or be embedded into other systems. The software includes a range of features such as report creation and editing, secure storage, scheduling, and automated delivery to clients.
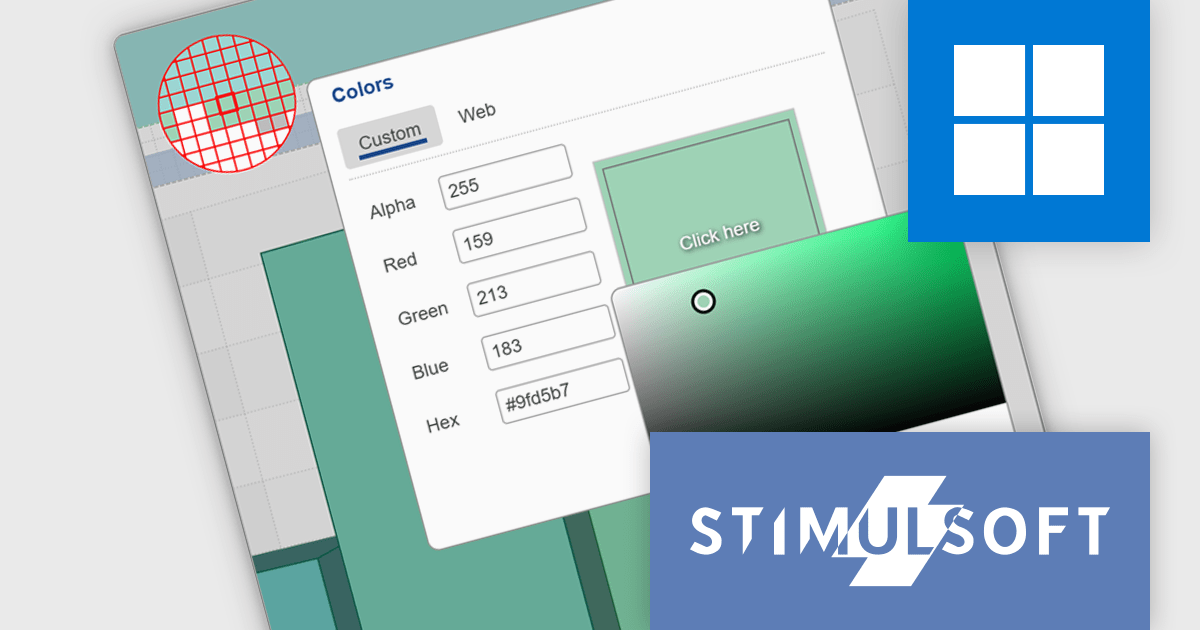
The Stimulsoft BI Server introduces a new Eyedropper Tool in the Web Designer, enabling developers to sample colors directly from any area of an image with enhanced precision using a hover zoom feature. This tool improves the efficiency of UI customization by allowing quick identification and application of exact color values without external software. Additionally, it supports copying color codes in RGB, HEX, and HLS formats, offering greater flexibility when aligning report visuals with application themes, branding guidelines, or front-end design specifications.
Stimulsoft BI Server is available as a perpetual license and is licensed per creator. A creator has an account on the server, has access from the client-side, registered as an editor, and uses the product to work with report templates and dashboards - create, edit, view, delete, etc. See our Stimulsoft BI Server licensing page for full details.
Stimulsoft BI Server is available in the following products:
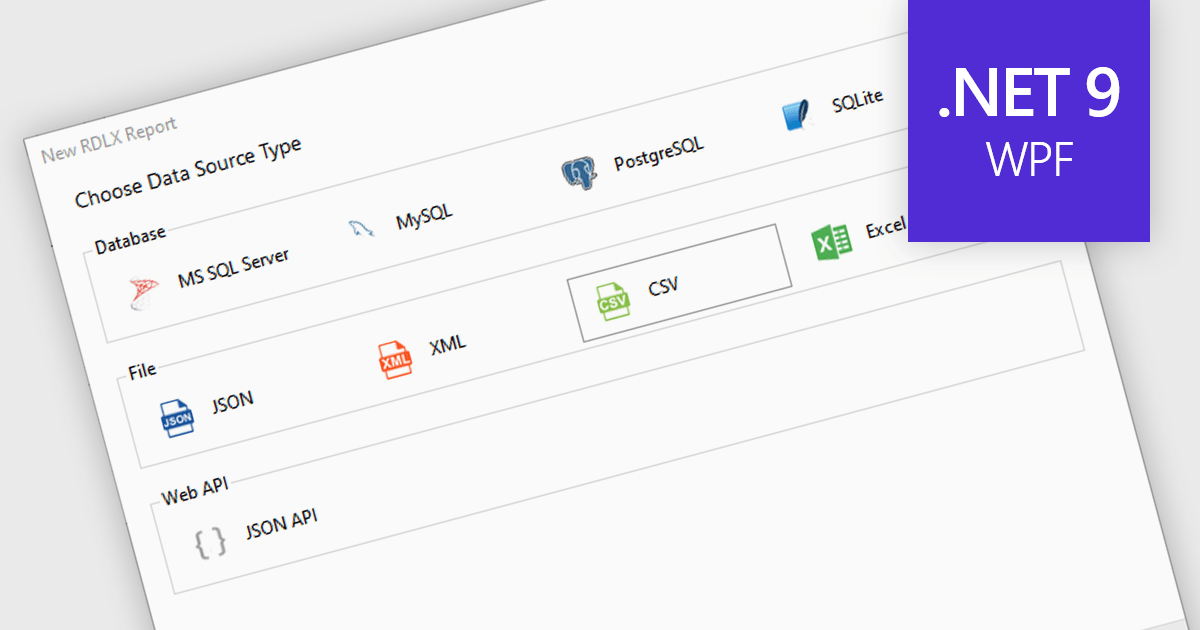
Excel / CSV data connectivity in a .NET 9 WPF reporting controls refers to the built-in capability to directly import and use data from Microsoft Excel spreadsheets or comma-separated value files as data sources for generating reports. This allows developers to integrate reporting functionality into their desktop applications without needing intermediate data transformations or external database connections. It simplifies the development workflow by supporting widely used formats, ensures compatibility with existing business data, and reduces the need for additional parsing or data handling logic. The result is faster report generation and easier access to commonly used data formats.
Several .NET 9 WPF reporting controls offer Excel / CSV data connectivity including:
For an in-depth analysis of features and price, visit our comparison of .NET 9 WPF reporting controls.
Stimulsoft Dashboards.WIN is a versatile suite of tools for crafting interactive data visualizations for web and desktop applications. It empowers developers to embed intuitive dashboards across various platforms, using platform-specific components or a centralized cloud designer. With data analysis elements, customization options, and pre-built templates, Stimulsoft Dashboards helps you transform complex data into clear, actionable insights for any audience.
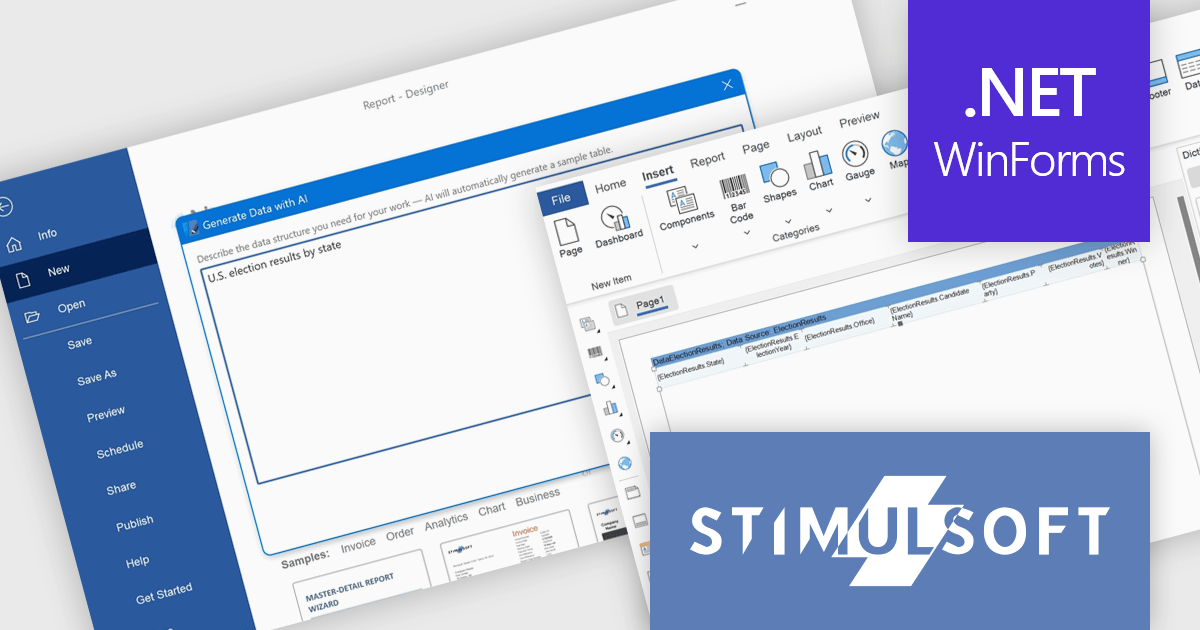
The latest Stimulsoft Dashboards.WIN update introduces AI-powered data generation, enabling developers to quickly create realistic sample datasets using natural language prompts directly within the report designer. This improves the prototyping process by removing the need for manual data setup or external demo files, allowing for faster iteration, testing, and visualization of report layouts.
Stimulsoft Dashboards.WIN is licensed per developer and is available as a perpetual license with 1 year support and maintenance. See our Stimulsoft Dashboards.WIN licensing page for full details.
Stimulsoft Dashboards.WIN is available individually or as part of Stimulsoft Ultimate.
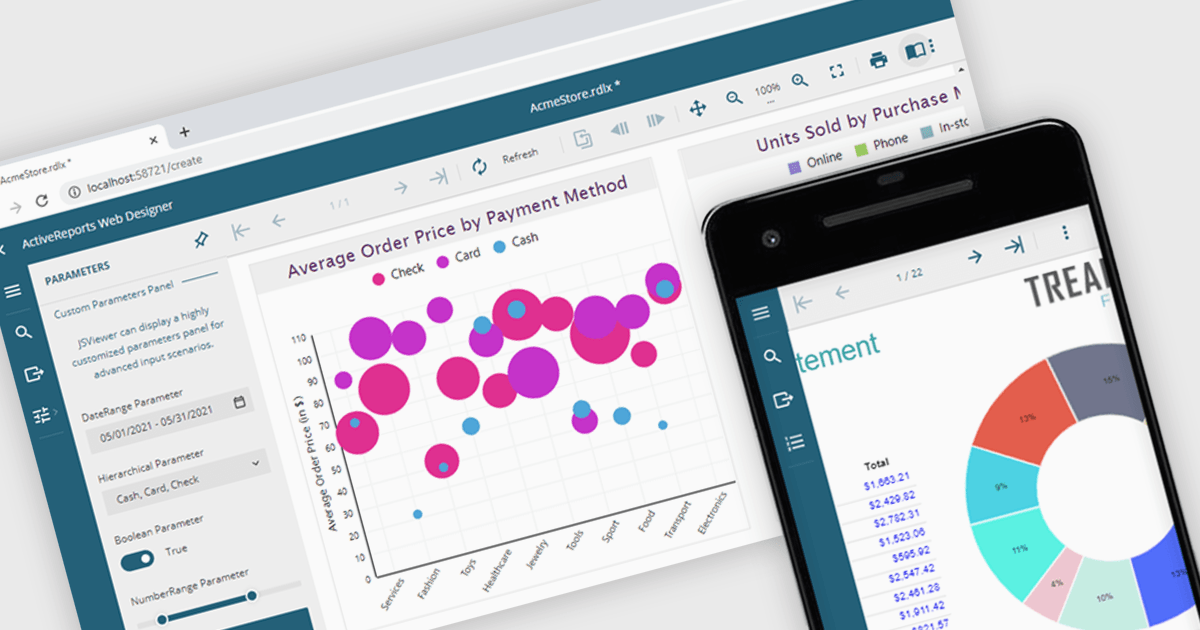
A JavaScript report viewer in a .NET reporting component is a client-side web interface that allows users to view, navigate, and interact with reports generated by a .NET-based reporting engine. It enables embedding of reports into web applications built with JavaScript frameworks such as Angular, React, or Vue, while relying on the .NET backend to handle report generation and data processing. This setup allows developers to deliver responsive, interactive report viewing experiences within modern browser environments, without requiring full-page reloads or complex server-side rendering.
Several .NET reporting controls feature a JavaScript report viewer including:
For an in-depth analysis of features and price, visit our comparison of .NET reporting controls.
Stimulsoft Reports.JS provides a robust reporting toolkit designed specifically for JavaScript applications. This library leverages a client-side architecture, offering a pure JavaScript report engine for efficient report rendering directly within web browsers. The solution includes a user-friendly report designer for building reports with various data sources and visualizations, along with a report viewer for seamless integration and display within your JavaScript applications. This eliminates the need for server-side dependencies or browser plugins, simplifying the development process for embedding powerful reporting functionalities into your web projects.
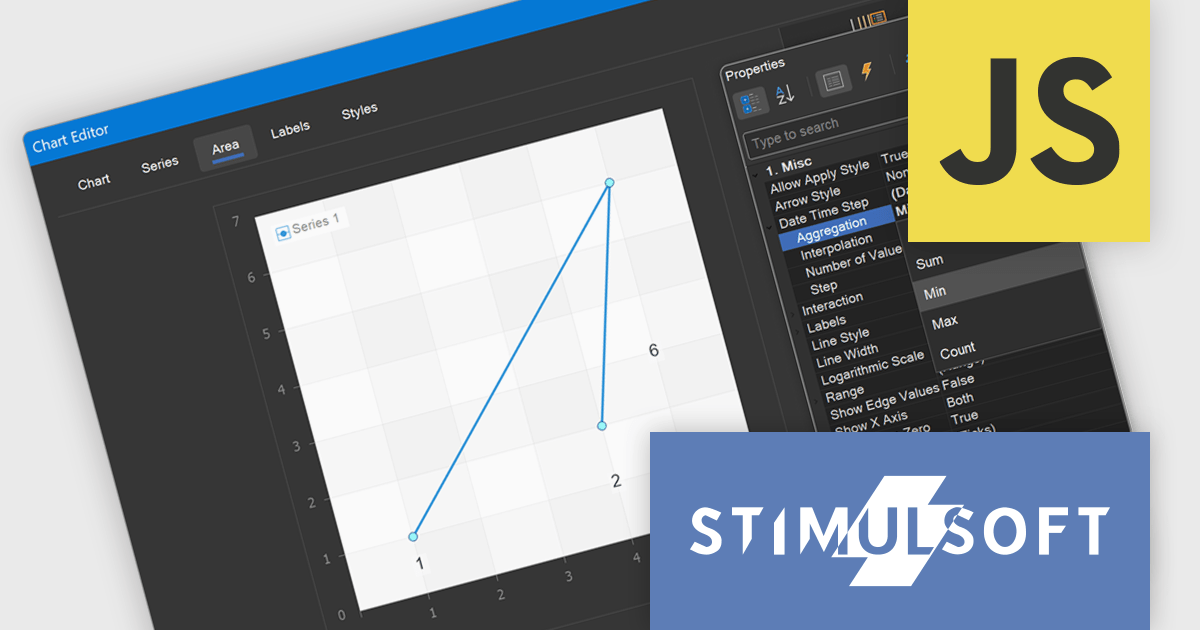
Stimulsoft Reports.JS now supports aggregation for Date Time Step, allowing developers to select from multiple data aggregation functions including Average, Sum, Min, Max, and Count. This enhancement provides greater control over how time-based data is grouped and displayed in report charts, enabling more accurate and relevant visualizations based on the specific nature of the dataset. By choosing the appropriate aggregation method, developers can optimize performance reporting, reveal insights more effectively, and better align visual outputs with analytical requirements.
Stimulsoft Reports.JS is licensed per developer and is available as a Perpetual license with 1 year support and maintenance. See our Stimulsoft Reports.JS licensing page for full details.
Stimulsoft Reports.JS is available individually or as part of Stimulsoft Ultimate.





Tél : (888) 850 9911
Fax : +1 770 250 6199


