


Fournisseur officiel
Comme nous somme les distributeurs officiels et autorisés, nous vous fournissons des licences légitimes directement à partir de 200+ éditeurs de logiciels.
Voyez toutes nos marques.
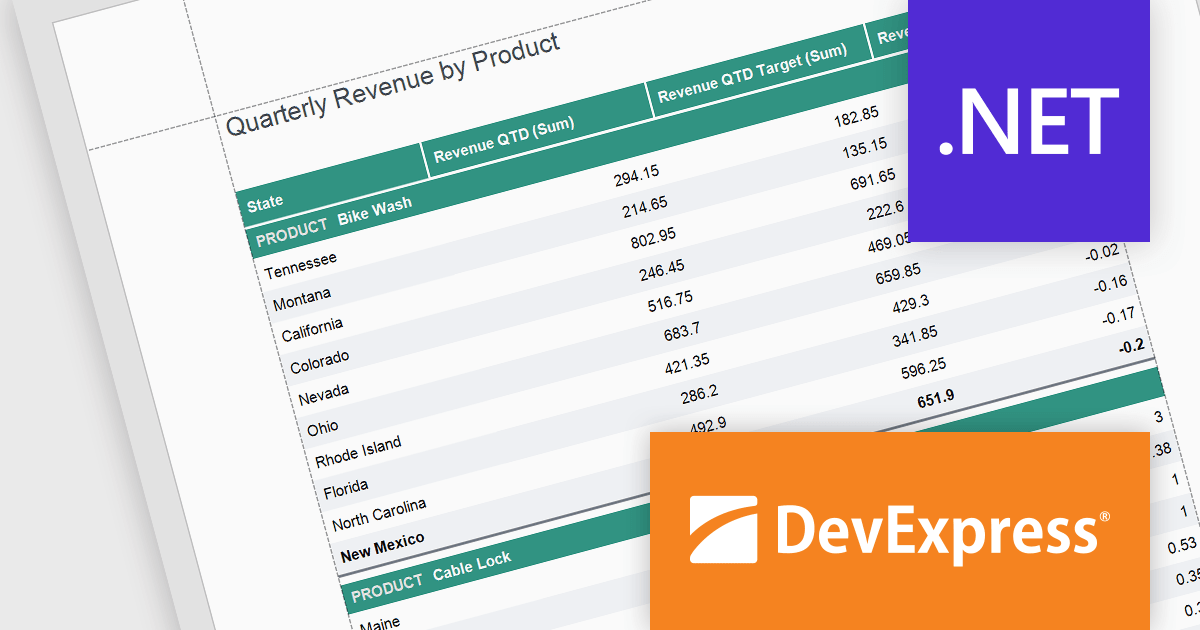
DevExpress Reporting is a comprehensive suite of reporting tools that empowers developers to create visually stunning and highly customizable reports for various applications. With its rich feature set, including data binding, layout design, printing, and exporting capabilities, DevExpress Reporting enables the efficient creation of reports that meet the most demanding business requirements.
The DevExpress Reporting v24.1 release introduced several functions that allow you to obtain indexes for group elements. In this blog post, the DevExpress Reporting Team demonstrates these new expression functions and takes you through several usage scenarios, including:
Read the complete blog and get started using these new functions in DevExpress Reporting.
DevExpress Reporting is licensed per developer and is available as a Perpetual License with a 12 month support and maintenance subscription. See our DevExpress Reporting licensing page for full details.
DevExpress Reporting is available to buy in the following products:
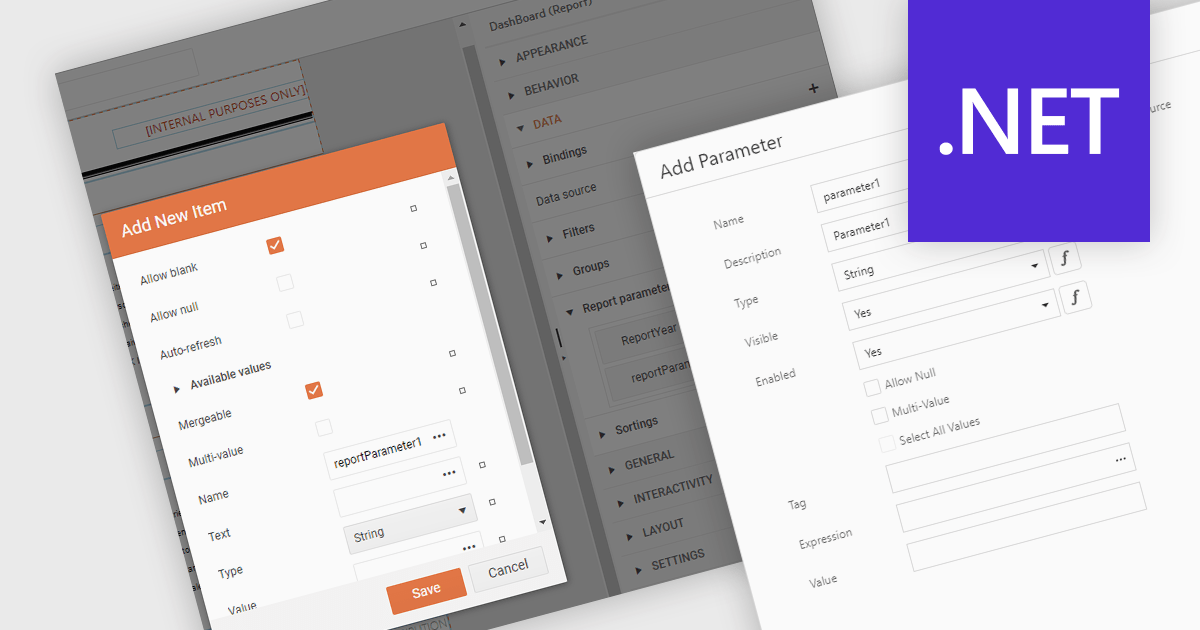
Dialog forms for parameters in .NET reporting components offer a user-friendly interface for defining and modifying report parameters. By providing intuitive input fields, drop-down menus, and browsing options, these forms simplify the report creation process and reduce the likelihood of errors. This is particularly beneficial for non-technical users, who can easily generate customized reports without requiring extensive knowledge of report syntax or data structures. Example use cases include creating sales reports based on specific product categories or time periods, generating financial statements with customizable filters, and producing personalized customer reports based on individual preferences.
Several .NET reporting components allow you to create dialog forms for parameters, including:
For an in-depth analysis of features and price, visit our comparison of .NET reporting components.
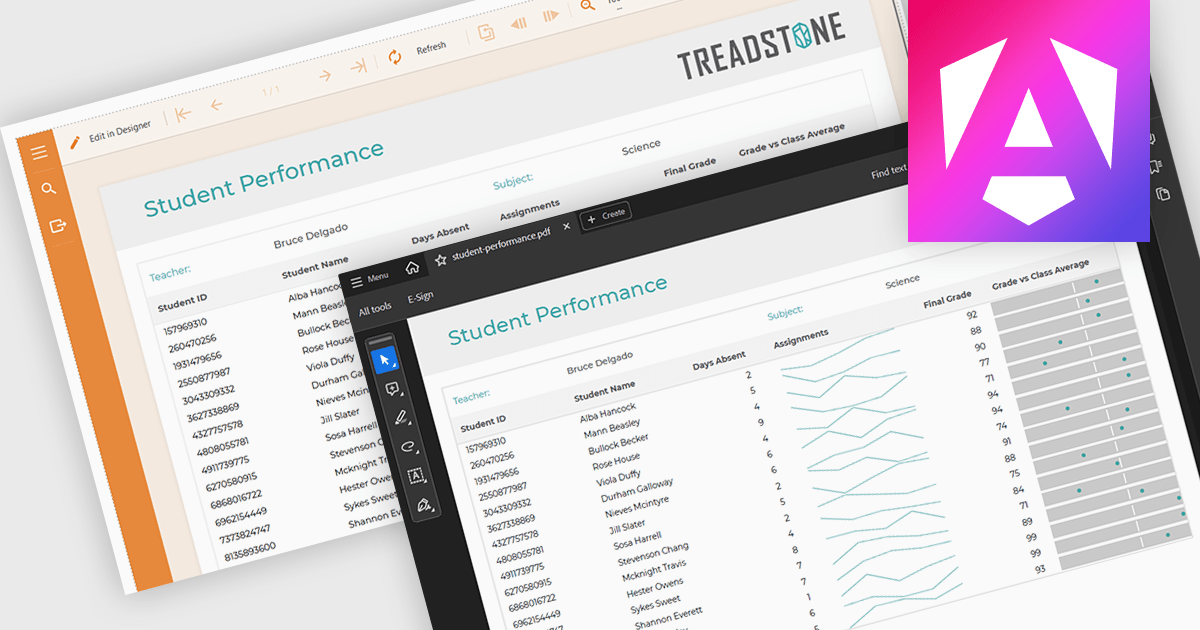
PDF export functionality within a reporting component enables the transformation of generated report data into a portable, high-fidelity PDF document. This capability offers significant advantages, including standardized document format compatibility, enhanced security through encryption options, optimized file size for efficient storage and transmission, and preservation of complex layout and formatting, ensuring consistent visual representation across different platforms and devices.
Several Angular reporting components offer PDF export support including:
For an in-depth analysis of features and price, visit Angular reporting components comparison.
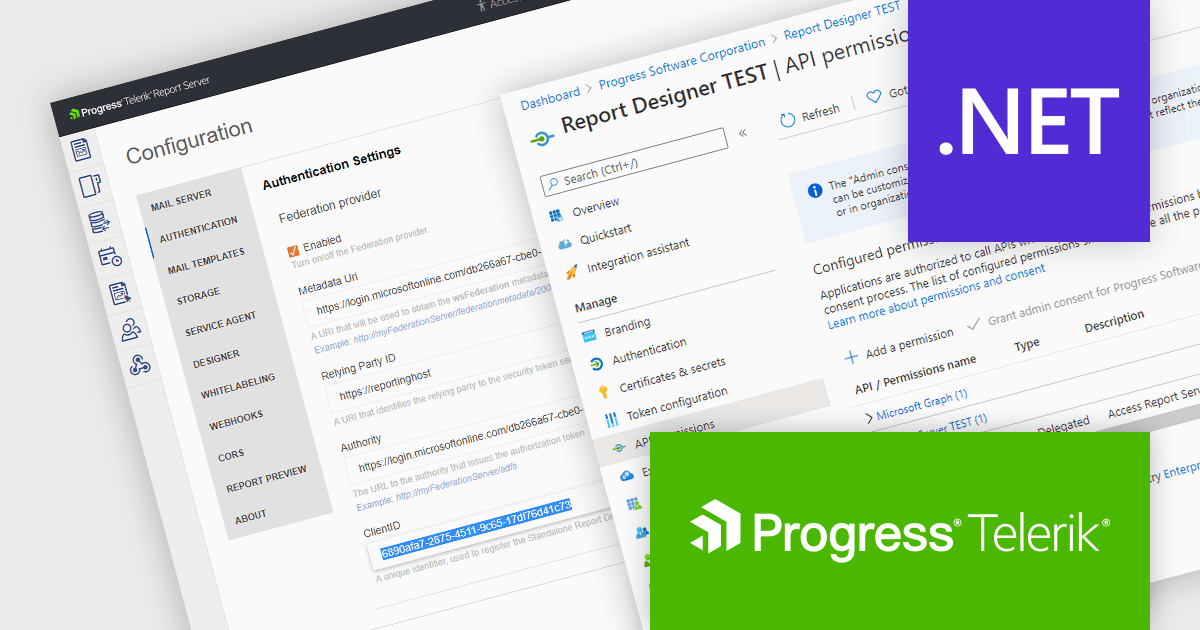
Telerik Report Server is a comprehensive and flexible end-to-end solution for managing reports. Built with the Telerik Reporting library, it is a server-based Windows web application that provides centralized storage, organization, and previewing of reports, along with features for scheduling, delivery, and user management. Report Server can act as a standalone solution or be integrated within an application, allowing developers to create, manage, and distribute reports across multiple platforms including Blazor, Angular and Windows Forms.
The Telerik Report Server 2024 Q3 update (10.2.24.806) adds support for Microsoft Entra ID as an authentication method in .NET environments. Entra ID, formerly known as Azure Active Directory, is an identity and access management solution that can now be configured as a part of the Report Server for .NET authentication methods. This integration enables single sign-on (SSO) authentication, which eliminates the need for separate credentials and improves the user experience, whilst ensuring that access to report management is tightly controlled and aligns with the broader enterprise security policies.
To see a full list of what's new in 2024 Q3 (10.2.24.806), see our release notes.
Telerik Report Server is available as a perpetual license and is licensed per domain. Each domain license contains 15 Client Access Licenses and 1 year support and maintenance. See our Telerik Report Server licensing page for full details.
Telerik Report Server is available in the following products:
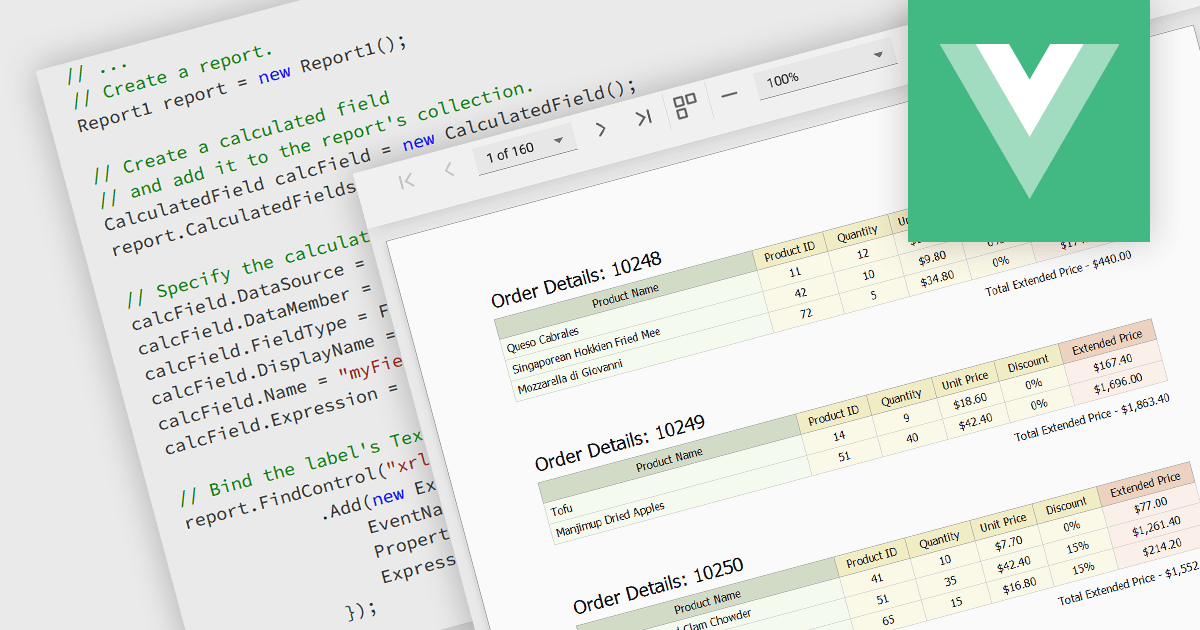
Calculated fields are dynamic values derived from existing data within reporting components. They enable complex data manipulations, calculations, and transformations, providing enhanced data analysis capabilities. By creating new fields based on existing data, calculated fields offer flexibility and efficiency, allowing users to perform calculations, aggregations, and logical comparisons directly within the report. This empowers users to generate insights, visualize trends, and make data-driven decisions without requiring modifications to the underlying data source, ultimately improving report accuracy and usability.
Several Vue.js reporting components offer support for calculated fields:
For an in-depth analysis of features and price, visit Vue.js reporting components comparison.


Tél : (888) 850 9911
Fax : +1 770 250 6199


