Nouvelles Spreadsheets

Gérez les feuilles de calcul dans .NET 8

Décembre 12, 2023
EPPlus V7.0.3 prend désormais en charge .NET 8, permettant aux développeurs de créer, lire et modifier des feuilles de calcul dans la dernière version de .NET.

EPPlus is a powerful and versatile .NET library for managing and manipulating Microsoft Excel files using the Office Open XML (OOXML) format. It is a lightweight and efficient library that is easy to use and can be integrated into a wide range of applications. It allows developers to create, read and modify spreadsheets without dependencies on any other library. Features include pivot tables, styling, VBA/Form controls, conditional formatting, charts, tables, formula calculation, data validation, pictures/shapes, and more.

The v7.0.3 release adds support for .NET 8. This enables developers to easily create and manage spreadsheets while working with the latest iteration of Microsoft's .NET ecosystem.

To see a full list of what's new in v7.0.3, see our release notes.

For more information, see our EPPlus product page.

Importez et exportez des fichiers Excel XLSX en JavaScript

Décembre 5, 2023
Utilisez SpreadJS de MESCIUS pour ajouter des feuilles de calcul JavaScript complètes à vos applications d’entreprise.

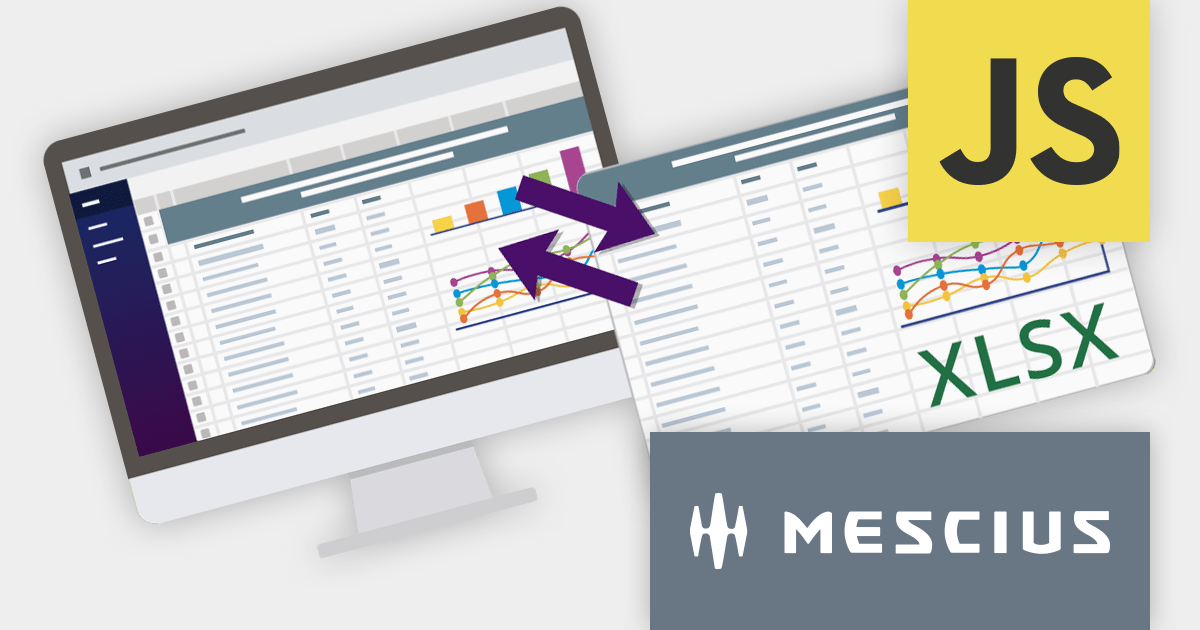
SpreadJS is a complete enterprise JavaScript spreadsheet solution used to create financial reports and dashboards, budgeting and forecasting models, scientific, engineering, healthcare, education, science lab notebooks, and other similar JavaScript business applications. Spreadsheets are a primary medium for displaying and sharing vital company data and it is crucial that this data can be easily viewed and updated in your JavaScript applications.

In this blog post, MESCIUS Product Manager Kevin Ashley shows you how to leverage the power of SpreadJS to import and export Excel spreadsheets into your enterprise web applications. Steps include:

  • Setting up the JavaScript Spreadsheet Project
  • Adding Excel Import Code
  • Adding Data to the Imported Excel File
  • Adding a Sparkline
  • Adding Excel Export Code

View the complete blog and start working directly with Excel files in your JavaScript applications.

For more information visit our SpreadJS product page.

Illustrez les données en ajoutant des graphiques aux Feuilles de calcul ASP.NET Core

Novembre 27, 2023
Visualisez les données et les tendances de votre feuille de calcul à l'aide de graphiques, améliorant ainsi la communication à partir des données et la prise de décisions.

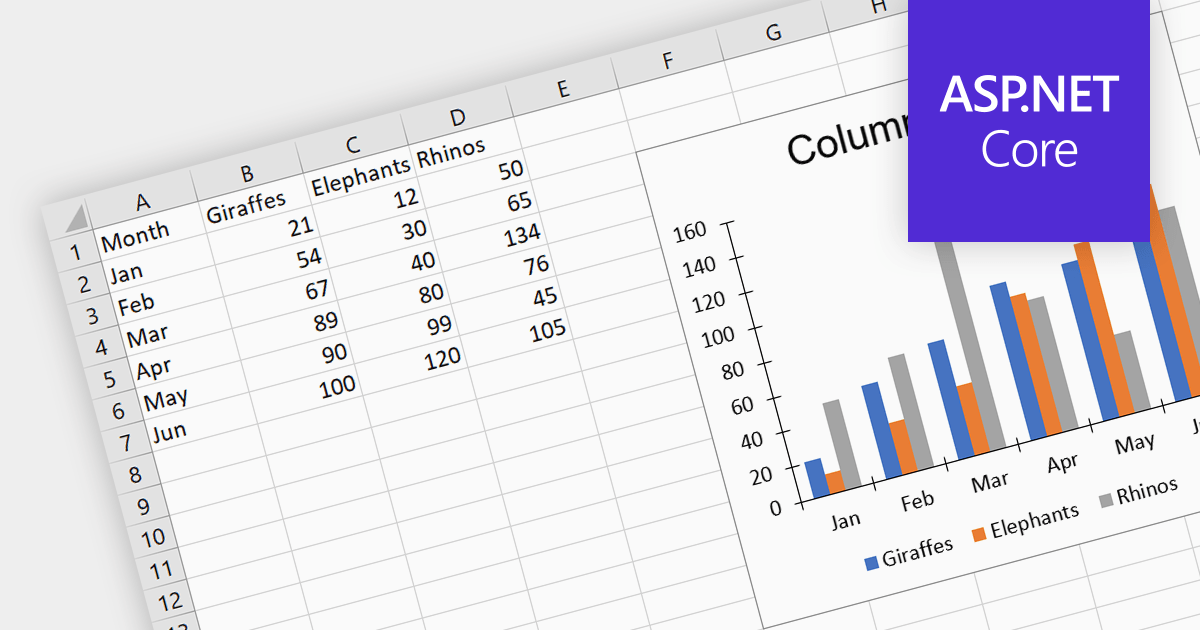
Charts help to transform complex numerical spreadsheet data into easily understandable graphical representations. They make it easier to identify patterns, trends, and relationships within the data, enabling faster comprehension and identification of key insights. This visual approach enhances communication and promotes informed decision-making. Charts can be particularly useful for presentations and performance tracking, allowing for effective data sharing and dissemination of insights.

Several ASP.NET Core spreadsheet controls offer charting support including:

  • IronXL by Iron Software is a lightweight and easy-to-use library which can be used for creating charts in ASP.NET Core spreadsheets. It supports a broad selection of chart types, such as bar charts, line charts, pie charts, and scatter plots.
  • Document Solutions for Excel, .NET Edition by MESCIUS (formerly GrapeCity) is a comprehensive library for working with Excel files in ASP.NET Core applications. It includes a powerful charting module that supports a wide range of chart types and customization options.
  • Aspose.Cells for .NET is a mature and feature-rich library for creating charts in ASP.NET Core spreadsheets. It supports a variety of charts, including custom chart types.

Alternatively, many spreadsheet controls are available as part of multi-function suites:

  • DevExpress ASP.NET Core Spreadsheet (part of DevExpress ASP.NET and Blazor) is a popular and well-supported spreadsheet component which supports adding charts. It offers a user-friendly interface and supports a comprehensive range of chart types and extensive customization possibilities.
  • Infragistics ASP.NET Core Spreadsheet (part of Infragistics Ignite UI) is a powerful and versatile library which allows you to create charts in ASP.NET Core spreadsheets. It provides an extensive library of chart types and granular customization controls for crafting personalized charts.
  • Syncfusion ASP.NET Core Spreadsheet (part of Syncfusion Essential Studio Enterprise) is a high-performance ASP.NET Core component which lets you create charts in spreadsheets. It includes a rich collection of chart types and versatile customization options for tailoring charts to your audience and data.

For an in-depth analysis of features and price, visit our comparison of ASP.NET Core spreadsheets.

Compare ASP.NET Core Spreadsheets

Sécurisation des feuilles de calcul dans les applications ASP.NET Core

Novembre 22, 2023
Aidez les utilisateurs à protéger les données sensibles des feuilles de calcul et éviter tout accès, modification ou suppression non autorisés.

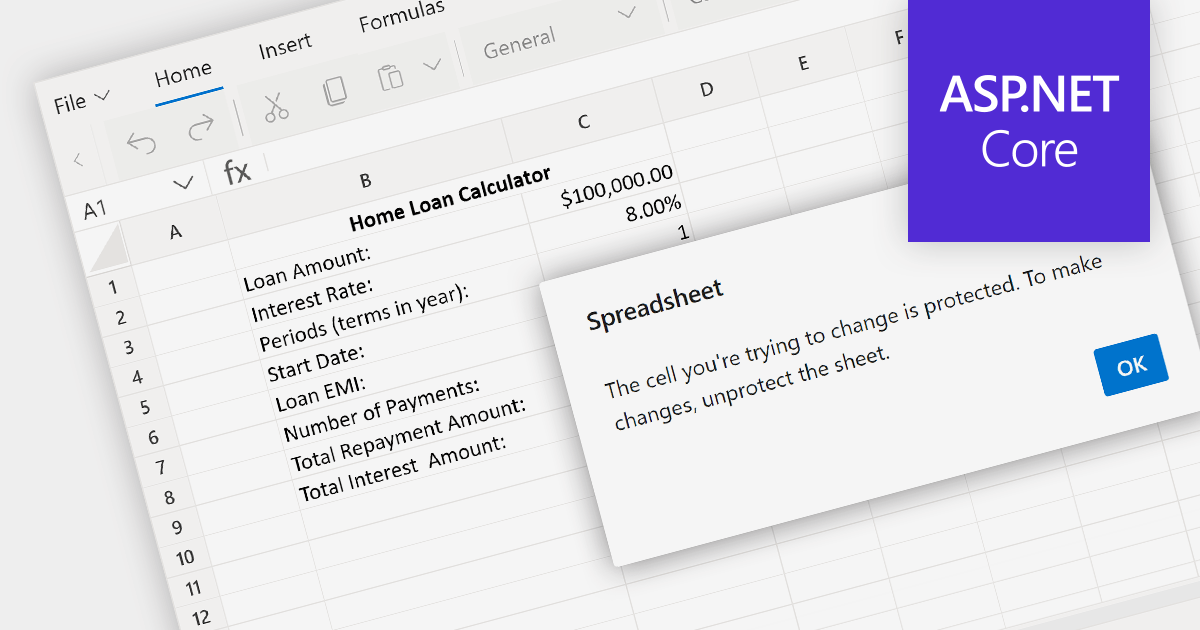
Spreadsheet security features safeguard sensitive data within a spreadsheet. This can include password protection for opening the spreadsheet, encrypting the data, and setting permissions that control who can view or edit specific cells, ranges, or sheets. In an environment where spreadsheets contain confidential or proprietary information, such security features are crucial for preventing unauthorized access and ensuring that data manipulation is restricted to authorized users.

Several ASP.NET Core spreadsheet components provide spreadsheet security including:

  • IronXL by Iron Software protects sensitive data using spreadsheet permissions and passwords.
  • Aspose.Cells for .NET provides robust security features to protect your spreadsheet data, including access control and data validation.
  • Telerik Spread Processing (part of Telerik UI for ASP.NET Core) offers comprehensive security mechanisms to safeguard your spreadsheet data, including worksheet protection.
  • Syncfusion ASP.NET Core Spreadsheet (part of Syncfusion Essential Studio Enterprise) ensures data integrity and confidentiality with advanced security measures including password encryption and workbook protection.

For an in-depth analysis of features and price, visit our comparison of ASP.NET Core Spreadsheet components.

Compare ASP.NET Core Spreadsheet Components

Visualisez les données en ajoutant des graphiques aux feuilles de calcul WPF

Novembre 20, 2023
Transformez des données complexes en visualisations attrayantes à l’aide des composants de feuille de calcul WPF .NET. Améliorez l’analyse des données et les informations grâce à des tableaux et des graphiques interactifs.

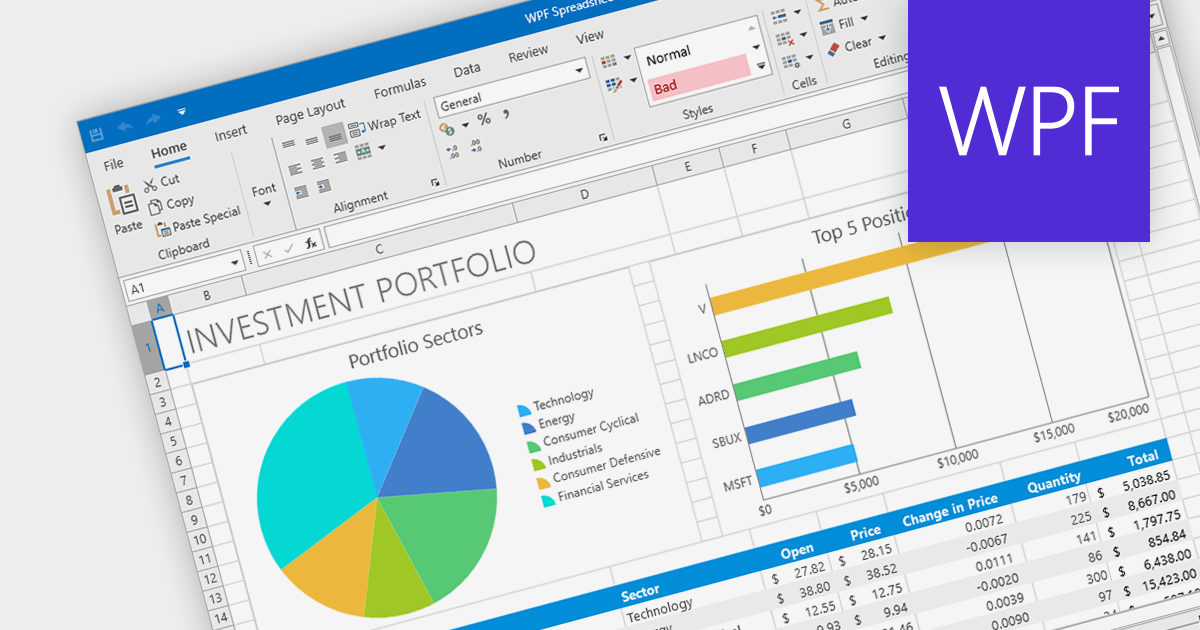
Charts are integral to spreadsheets, enabling users to transform data into visually compelling representations. These graphical formats, such as pie, line, bar, and area charts, effectively convey complex information by highlighting trends, patterns, and anomalies. Spreadsheet software with advanced charting capabilities empowers users to create dynamic charts that adapt seamlessly to data updates, making them invaluable tools for reporting, presentations, and data analysis.

Several .NET WPF spreadsheet components provide chart support including:

  • DevExpress WPF Spreadsheet (Part of DevExpress WPF) helps you visualize spreadsheet data effectively with a comprehensive collection of charts for WPF.
  • Infragistics WPF Spreadsheet (Part of Infragistics Ultimate UI for WPF) enhances WPF spreadsheet data analysis and insights with a wide range of customizable charts and graphs.
  • Spread.NET WPF by MESCIUS (formerly GrapeCity) creates impactful data visualizations with a variety of built-in charts for WPF spreadsheets.
  • Telerik WPF Spreadsheet (Part of Telerik UI for WPF) elevates data presentation in WPF spreadsheets with a rich collection of interactive charts and graphs.

For an in-depth analysis of features and price, visit our comparison of .NET Spreadsheet components.

Compare .NET WPF Spreadsheet Components