NetAdvantage for Silverlight adds Funnel Chart

New Data Visualization chart shows diminishing values which represent data as different portions of 100%.
Novembre 18, 2011
Édition

Infragistics NetAdvantage for Silverlight Data Visualization includes controls for geospatial mapping, interactive gauges, graphical timelines and animated charting. It allows you to build rich dashboards and visualize business data by simplifying the presentation of your business intelligence.

Updates in 2011 Volume 2

  • Resource Washer - set the color on groups of resources in an existing ResourceDictionary to update the color of the controls in your applications.
  • Infragistics Excel Library - support has been added for shapes, data validation, print titles, print area and page breaks.
  • Geographic Map - create highly detailed, thematic geographical maps.
  • Funnel Chart - displays data in a funnel shape with a variable number of sections, each representing the data as a portion of 100%.
  • Sparkline Chart - a data-intense, design-simple graphic that allows end users to spot trends, variations and patterns in data.
  • Data Chart – now includes the following new features: OLAP axis, error bars, 15 new chart series, weighted moving average trend line and correlation formula.
  • Pivot Grid - lets your users slice, dice and filter multi-dimensional data of your OLAP cube or data warehouse.
  • Timeline – now allows the adjustment of labels and tick marks based on the current zoom level (which is the visible area of the chart).
  • Network Node Diagrams – new features include the ability to choose the relationship type between nodes, support for various visual states and manipulation of individual nodes.

About Infragistics

Infragistics has been the market leader in presentation layer components for over 18 years. With a comprehensive portfolio of multi-platform Enterprise Software products and services, we have achieved global reach in nearly every Fortune 2000 company. Infragistics empowers developers to build and style great application user interfaces for Windows Forms, ASP.NET, WPF and JSF, and additionally offers user interface test tools, support, training and consulting services.
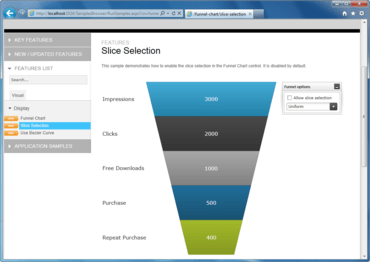
A Funnel Chart showing data.

Infragistics NetAdvantage for Silverlight

Achieve rich, advanced data visualization that leverages the sophisticated capabilities of Silverlight.

Vous avez une question ?

Discutez en direct avec l'un de nos spécialiste des licences Infragistics .