ComponentOne Studio LightSwitch 2016 v2.5

Visualisez les données hiérarchiques avec le nouveau diagramme sunburst.
Septembre 19, 2016
Nouvelle Version

Fonctionnalités

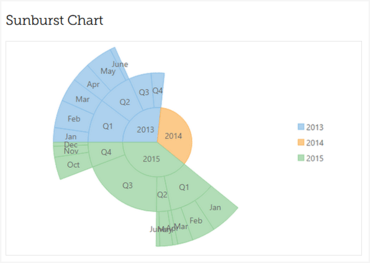
  • New Sunburst Chart - Sunburst or multi-level pie chart is used for visualization of hierarchical data. The circle in the center represents the root node with hierarchy moving outward from center. A segment of the inner circle is a parent to the segments of the outer circle which lie within the angular sweep of parent.
Sunburst charts let you visualize hierarchical data from a root node (center) outward to lower hierarchies.

ComponentOne Studio LightSwitch

Aucun code, productivité instantanée dans Visual Studio LightSwitch.

Vous avez une question ?

Discutez en direct avec l'un de nos spécialiste des licences MESCIUS (formerly GrapeCity) .