Stimulsoft Reports.Web 2017.1

Ajoute des graphiques interactifs permettant aux utilisateurs d'explorer les données.
Avril 27, 2017
Nouvelle Version

Fonctionnalités

  • Support for .NET Core - Added components for creating, editing and viewing reports using this technology. .NET Core components are represented by a full-featured HTML5 viewer and report designer.
  • TreeMap chart - When designing reports for data visualization you can now use a TreeMap chart. This diagram provides the ability to display a hierarchical view of the data.
  • The Anchor property - When a report component is placed on another one, you can set the anchors of the component.
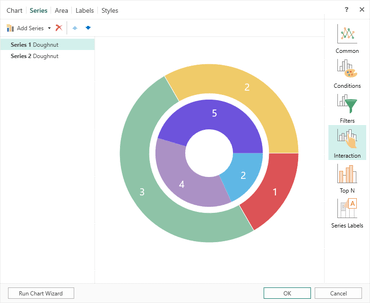
  • Interactive charts - When developing reports you can now drill-down into charts.
  • Group Sum in the map component - If you use the Map component in a report you can group data by countries or by continents, for example.
  • Primitives - Primitives are report design elements. To add a horizontal, vertical line, rectangle, rounded rectangle to the report, go to the Insert tab, and, in the Shapes menu, select the corresponding element.
  • Quiet Zone in barcodes - The quiet zone is a barcode separator for barcode readers.
  • New properties to resize components - Specify the maximum and minimum sizes of report components. When rendering reports, the component can grow to the maximum or can decrease to the minimum value.
  • New themes - Added 21 themes to the HTML5 viewer are added. This provides the ability to adjust the appearance of the viewer.
Interactive charts.

Stimulsoft Reports.WEB

Ajoutez des rapports flexibles et riches en fonctionnalités à vos applications Web.

Stimulsoft Reports.WEB est également disponible en :

Vous avez une question ?

Discutez en direct avec l'un de nos spécialiste des licences Stimulsoft .