Stimulsoft Reports.Wpf 2017.1

Composant de carte prenant en charge les groupements et ajoutant un nouveau type de graphique TreeMap.
Avril 27, 2017
Nouvelle Version

Fonctionnalités

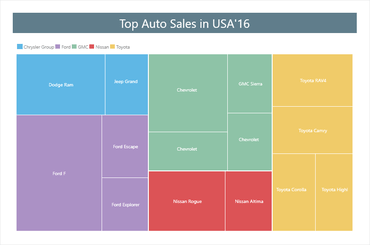
  • TreeMap chart - When designing reports for data visualization you can now use a TreeMap chart. This diagram provides the ability to display a hierarchical view of the data.
  • Anchor property - When a report component is placed on another one, you can set the anchors of the component.
  • Group sum in the Map component - If you use the Map component in a report, you can group data by countries or by continents, for example.
TreeMap chart.

Stimulsoft Reports.WPF

Incluez des rapports dans vos applications WPF.

Stimulsoft Reports.WPF est également disponible en :

Vous avez une question ?

Discutez en direct avec l'un de nos spécialiste des licences Stimulsoft .