Stimulsoft Ultimate 2019.2.1

Ajout d’un nouvel outil de traitement et d'analyse de données personnalisable pour la plateforme JavaScript.
Février 15, 2019
Nouvelle Version

Fonctionnalités

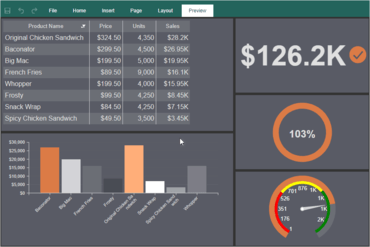
  • New product Dashboards.JS - A powerful, flexible and customizable data analysis and processing tool for the JavaScript platform. All that is needed is a JavaScript and HTML5 browser. Installing additional .NET, Java or Flash components is not required. Therefore, Dashboards.JS will work on most devices (from desktop computers to mobile devices). Dashboards.JS can work as a client-side or server-side solution and the tool is fully compatible with Node.js.
  • Pareto Chart - When designing reports and dashboards, you now have the ability to create Pareto charts. This type of chart contains both bars and a line graph, where individual values are represented in descending order by bars, and the cumulative total is represented by the line.
  • Top N Values - Chart, Indicator, Progress and Pivot dashboard elements can now display top values.
  • Disabling columns in Table - You can now hide columns in dashboard Table elements. In order to apply this, select the data field in the element editor and uncheck the Visible option.
  • Hyperlinks in values of a table - You can now set hyperlinks, if the field type is defined as a Dimension, for data field values.
  • Interaction - You can now customize interactive actions when viewing the dashboard. Depending on a specific user action, a hint can be displayed, data filtering can be applied, or transition by a hyperlink. Actions can be defined for items such as Chart, Regional Map, and Table.
  • Abbreviations in formatting - You can now use abbreviated numbers with numeric and currency formatting in reports or dashboards. For example, for thousands of values you may use the abbreviation K, for millionths M, for billionths B. To enable the use of abbreviations of values, set the checkbox next to Use Abbreviation in the format editor.
  • Negative red - Highlight all negative numbers with numeric, currency, and percentage formatting. This functionality will work for both reports and dashboards. To do this, set the checkbox next to Negative in Red in the format editor. Now all numbers that are less than zero will be marked in red.
  • Export to JSON - To convert the report, click Save in the report viewer, select the item Data File... and select JavaScript Object Notation (JSON) as the file type. You can export a whole report or data only or data with header and footers.
  • Exporting tables to Data - In the dashboard Table element, you now can export data of various types to files. To do this, when viewing the dashboard, click the Save button on the Table element and select the Data item. In the export settings menu, choose the type of data file (CSV, DBF, XML, JSON, DIF, SYLK) to which the contents of the Table element should be converted.
  • Export settings - This version adds export settings when exporting dashboards or their elements to various formats. You can change the page size, orientation, image quality, image type and scale. Export settings are displayed in a pop-up dialog, after selecting the export command and before starting the process of converting dashboards or their elements.
  • Editing the rendered dashboard - The Edit button has been added to the dashboard preview. This button calls the report designer and opens the rendered dashboard. In the report designer, you can edit the dashboard and save the changes. You will these changes in the viewer.
  • Calculation of totals by condition - It is now possible to use the functions of calculated totals with conditions in dashboard elements. The SumIf(,) function is used to sum the data field values by a condition, and the CountIf(,) function is used to count the number of values in a data field by a condition. The first argument in these functions is the data field, and the second is the condition for fetching values.
  • Text in cells in Reports.JS - A new component Text in Cells has been added to Reports.JS. You can use this component for designing reports.
Dashboards.JS

Stimulsoft Ultimate

Générez des rapports et des tableaux de bord dans vos applications.

Vous avez une question ?

Discutez en direct avec l'un de nos spécialiste des licences Stimulsoft .