Infragistics Ignite UI for React 19.1

Ajout d’un nouveau contrôle Map et amélioration des fonctions d’interaction des grilles.
Avril 23, 2019
Nouvelle Version

Fonctionnalités

Grid Interaction Features

  • Multi-Cell Selection (Contiguous and Non-Continguous) - This feature allows you to select individual cells or a contiguous group of cells. This is done by clicking each cell while holding down the CTRL or SHIFT key.
  • Cell Range Selection (Mouse / Keyboard) - This feature allows you to select a range of cells using the mouse or the keyboard. Ranges are selected in the following ways:
  • Mouse drag - Select a cell with the mouse click, drag, release the mouse over another cell, and the range from the selected cell and released cell will be the selected range.
  • CTRL and Mouse drag - Hold the CTRL key while using the mouse to create another range will keep individual ranges selected.
  • SHIFT and Click - Select a cell, hold the SHIFT key, select another cell, and the range of cells between the two selected cells will be selected.
  • Active Cell (Excel-Style Keyboard Navigation) - Added Excel-style keyboard navigation to change the active cell.

New Stacked Series for the React Chart

  • This release adds a variety of stacked series to DataChart, including area, bar, column, line, spline area, and spline.

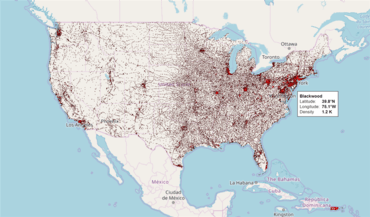
New Map Control

  • Visualize geographic and geo-spatial data.
  • Shape File Converter - In the Map control, the ShapefileConverter class loads geo-spatial data from shape files and converts it to a collection of ShapefileRecord objects. Geographic series can be bound to this collection and render geo-spatial data.
  • Data Binding - In addition to rendering data from shape files and geographic imagery maps, the React Map control also provides data binding to other data sources with geographic data using the data binding and data mapping properties of geographic series. The following is a preview of the Map control with GeographicSymbolSeries bound to a data model that contains locations of some cities of the world.
  • High-Performance Rendering - The React Map control provides plotting of tens of thousands of data points and updates them every few milliseconds so that the control can handle your real-time feeds.
  • Geographic Imagery Maps - This control provides the rendering of geographic imagery from Open Street Maps.
  • Geographic Series - Use this control to render an unlimited number of geographic series that can display geo-spatial data as points, polylines, and polygons.
  • Geographic Series Types - For Geographic Series, the map control provides these types below plus many more:
    • Scatter Area Series
    • Scatter Bubble Series
    • Contour Line Series
    • High Density Scatter Series
    • Scatter Symbol Series
    • Shape Polygon Series
    • Shape Polyline Series
  • Map Navigation - The React Map control provides customizable navigation behaviors for navigating map content using the mouse, keyboard, or code-behind.
React Map control

Infragistics Ignite UI for React

Grille de données hautes performances et graphiques de grands volumes de données.

Vous avez une question ?

Discutez en direct avec l'un de nos spécialiste des licences Infragistics .