Highcharts JS v8.0.0

Inclut un nouveau graphique à barres de type radial ainsi que le tri de données accompagné d'animations.
Décembre 12, 2019
Nouvelle Version

Fonctionnalités

  • Added new series type, radial bar chart. Under the hood, this is a column series in an inverted and polar chart.
  • Added data sorting with animations on update.
  • Added marker clusters for scatter point series.
  • Added new option accessibility.linkedDescription.
  • Added new accessibility options with more flexibility for customizing the hidden screen reader regions.
  • Added flame chart demo.

Correctifs

  • Fixed #12053 and #12152, pattern fill issues. Introduced color.patternIndex option.
  • Fixed #7255, trying to printing chart again, after cancelling in Safari, elements other than chart were not hidden.
  • Fixed #12488, selection zoomed to wrong area in the Treemap series.
  • Fixed issue with wrong extremes for bubble series when xAxis.max set.
  • Fixed #12549, disabling keyboard nav still added container tabindex.
  • Fixed #12438, a regression causing the reset zoom button not to work with the a11y module on mobile.
  • Fixed #12462, filename with forward slash (/) not being replaced with safe character when exported. Now replaced with -.
  • Fixed issue with data labels visible despite point placed outside the plot area, see #12370.
  • Fixed #12343, noData message was not visible with gauge series. Added 1 as default zIndex to render the message in front.
  • Fixed #12500, updating dataLabel color from contrast to a different one was not working.
  • Fixed #12459, annotation's control points were not draggable.
  • Fixed #12425, updating sunburst series used to disable traversing.
  • Fixed compatibility issues with menu navigation for screen readers.
  • Fixed #12161, legend textDecoration hidden style not working on IE11 with accessibility module enabled.
  • Improved handling of null point accessibility.
  • Fixed #12090, a11y module broke legend navigation.
  • Fixed minor bugs with keyboard navigation.
  • Fixed #12434 and #12097, regression in venn series label positioning causing JavaScript error.
  • Fixed #12445, updating borderColor and borderWidth didn't work for solid gauge series.
  • Fixed #12421, high contrast mode used to throw errors when the colorAxis module was not loaded.
  • Fixed #12390, not overlapping dataLabels after zoom in and zoom out were hidden.
  • Fixed #12262, Sunburst did not use 100% of the plot area.
  • Fixed #12374, sankey nodes were rearranged after redraw where the nodes.level option was used.
  • Fixed #12295, null was used as event listener in drilldown module, which caused a JavaScript error when called.
  • Fixed #12335, memory leaks in polar series after updating data set.
  • Fixed #12333, setting data in treemap series with points with the same ID's did not render new points.
  • Fixed #12289, sonification timeline issues with multiple charts.
  • Fixed #11617, support tooltip.split with chart.scrollablePlotArea.
  • Fixed #12267, error in waterfall chart when the series was invisible and the first value was below 0.
  • Fixed #12248, the Y axis' range was disturbed on stacked (overlapping) waterfall chart.
  • Fixed #11758, stackLabels in styled mode used to throw errors.
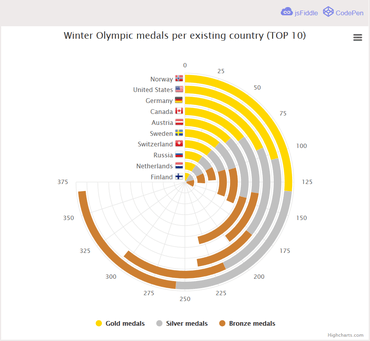
Highcharts Radial Bar Chart.

Highcharts Core

Visualisation de données, graphiques et diagrammes pour les pages Web et les applications Web.

Highcharts Core est également disponible en :

Vous avez une question ?

Discutez en direct avec l'un de nos spécialiste des licences Highsoft .