Froala Charts v1.0

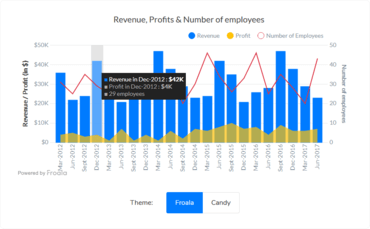
Graphiques interactifs pour créer des rapports et des tableaux de bord réactifs pour les applications Web et mobiles.
Novembre 24, 2020
Nouveau produit

Fonctionnalités

  • Highly Customizable and Easy To Use:
    • Froala Charts needs no learning curve.
    • Easy to use APIs.
    • Numerous config options to customize charts to your specific needs.
    • Great looking themes.
    • Smart defaults to auto-detect the best charts for your data.
    • Fully control the look-and-feel of charts.
  • Easy front-end integrations
    • Written in plain JavaScript.
    • Allows integration into popular JS Frameworks:
      • React.
      • Angular.
      • Vue.
      • Svelte.
      • Ember.
  • Modern Charting Features
    • Drill down capabilities.
    • Customizations on specific events.
    • Number formatting options.
    • Tooltips to convey quick info, and more.
  • Extensive Documentation and Examples
    • Detailed docs and plenty of library specific examples.
    • Includes source code so you can hit the ground running.
  • Cross-browser and platform compatibility
    • From Microsoft Internet Explorer 8 to Google Chrome.
    • Works seamlessly across multiple platforms.
Froala Charts

Froala Charts

Graphiques interactifs pour créer des rapports et des tableaux de bord réactifs pour les applications Web et mobiles.

Vous avez une question ?

Discutez en direct avec l'un de nos spécialiste des licences Froala .