Composants / Fast Reports / Vizuly / Clever Components

  1. $$$ | Acheter

    Description : A universal component for generating reports in cross-platform applications using the Avalonia UI. FastReport Avalonia allows the generation of reports and documents, as well as the export of finished files to a variety of data formats. Develop your ... Lire la suite Affichez plus de résultats de ce produit

  2. Description : A universal component for generating reports in cross-platform applications using the Avalonia UI. FastReport Avalonia allows the generation of reports and documents, as well as the export of finished files to a variety of data formats. Develop your ... Lire la suite

  3. $$$ | Acheter

    Description : Reporting and document creation library for WPF. FastReport WPF is a powerful library for report generation which allows you to create, view, and export detailed, interactive reports using a lightweight, multi-functional reporting tool. Use it to create ... Lire la suite Affichez plus de résultats de ce produit

  4. Description : Bibliothèque de création de rapports et de documents pour WPF. FastReport WPF is a powerful library for report generation which allows you to create, view, and export detailed, interactive reports using a lightweight, multi-functional reporting tool. Use ... Lire la suite

  5. $$ | Acheter

    Description : Data visualization library for.NET WinForms. FastReport Business Graphics.NET library allows you to visualize hierarchical data and build business diagrams for further analysis. You can connect to data from any application, including FastCube.NET. ... Lire la suite Affichez plus de résultats de ce produit

  6. Description : Bibliothèque de visualisation de données pour.NET WinForms. FastReport Business Graphics.NET library allows you to visualize hierarchical data and build business diagrams for further analysis. You can connect to data from any application, including ... Lire la suite

  7. $$$ | Acheter

    Description : Add charts and visualizations to your JavaScript apps. Vizuly Professional includes Corona, Halo, Radial Bar, Ring Chart, Weighted Tree, Geo Plot, Bar Chart, Column Chart, Line Area Chart, Radar Chart, Radial Progress, Scatter Plot, Sunburst, Tree Map, ... Lire la suite Affichez plus de résultats de ce produit

  8. Description : Ajoutez des graphiques et des visualisations à vos applications JavaScript. Vizuly Professional includes Corona, Halo, Radial Bar, Ring Chart, Weighted Tree, Geo Plot, Bar Chart, Column Chart, Line Area Chart, Radar Chart, Radial Progress, Scatter Plot, ... Lire la suite

  9. $ | Acheter

    Description : Add Word Clouds to your JavaScript apps. Vizuly Word Cloud is a unique way to represent the occurrence rate of words within a given text stream. This visualization supports an exclusion list that will ignore common pronouns, profanity, or any words you ... Lire la suite Affichez plus de résultats de ce produit

  10. Description : Ajoutez des nuages de mots à vos applications JavaScript. Vizuly Word Cloud is a unique way to represent the occurrence rate of words within a given text stream. This visualization supports an exclusion list that will ignore common pronouns, profanity, or ... Lire la suite

  11. $ | Acheter

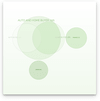
    Description : Add Venn Diagram charts to your JavaScript apps. Vizuly Venn Diagram shows all possible logical relations between a finite collection of different sets. This chart depicts elements as points in the plane, and sets as regions inside closed curves. A Venn ... Lire la suite Affichez plus de résultats de ce produit

  12. Description : Ajoutez des diagrammes de Venn à vos applications JavaScript. Vizuly Venn Diagram shows all possible logical relations between a finite collection of different sets. This chart depicts elements as points in the plane, and sets as regions inside closed ... Lire la suite

  13. $ | Acheter

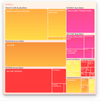
    Description : Add Tree Map charts to your JavaScript apps. Vizuly Tree Map visualizes hierarchical data in nested rectangular plots where the area of each rectangle is bound to a data property you can set. This TreeMap also supports the ability to drill down/up, in ... Lire la suite Affichez plus de résultats de ce produit

  14. Description : Ajoutez des graphiques de type arborescence à vos applications JavaScript. Vizuly Tree Map visualizes hierarchical data in nested rectangular plots where the area of each rectangle is bound to a data property you can set. This TreeMap also supports the ... Lire la suite

  15. $ | Acheter

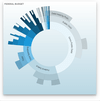
    Description : Adds Sunburst charts to your JavaScript apps. Vizuly Sunburst is designed to represent hierarchical data in a radial plot. It supports drill down and drill up capabilities by allowing the user to collapse and expand segments of the sunburst when they ... Lire la suite Affichez plus de résultats de ce produit

  16. Description : Ajoutez des graphiques en rayons de soleil à vos applications JavaScript. Vizuly Sunburst is designed to represent hierarchical data in a radial plot. It supports drill down and drill up capabilities by allowing the user to collapse and expand segments of ... Lire la suite

  17. $ | Acheter

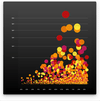
    Description : Add Scatter Plot charts to your JavaScript apps. Vizuly Scatter Plot shows 3 dimensions of data at once by plotting values along both the x and y axis as well as the radius of the plot itself. Each plot can be colored and styled dynamically based on your ... Lire la suite Affichez plus de résultats de ce produit

  18. Description : Ajoutez des graphiques en nuage de points à vos applications JavaScript. Vizuly Scatter Plot shows 3 dimensions of data at once by plotting values along both the x and y axis as well as the radius of the plot itself. Each plot can be colored and styled ... Lire la suite

  19. $ | Acheter

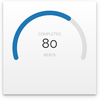
    Description : Show numeric values within a minimum and maximum range. Vizuly Radial Progress is designed to show numeric values within a minimum and maximum range. It can also show when a value has exceeded the maximum threshold. This chart supports a variable range of ... Lire la suite Affichez plus de résultats de ce produit

  20. Description : Afficher les valeurs numériques dans une plage minimale et maximale. Vizuly Radial Progress is designed to show numeric values within a minimum and maximum range. It can also show when a value has exceeded the maximum threshold. This chart supports a ... Lire la suite