Syncfusion Essential Studio for JavaScript 2018 Volume 2

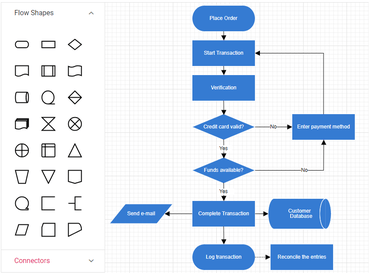
Il nuovo controllo diagramma consente agli utenti di generare rappresentazioni visive di informazioni, oltre a RDL Report Designer.
Settembre 11, 2018
Nuova versione

Funzionalità

  • Report Designer - The report designer component supports creating and editing RDL reports. Using the report designer, users can transform data into meaningful information and visualize it.
    • Provides a wide range of data sources.
    • Supports rich selection of report elements.
    • Provides parameters to filter out data.
    • Supports customization of report elements and management of images.
    • Built-in expression editor and query designer for customizing data and queries.
  • Chart
    • RTL support - Right-To-Left (RTL) support has been provided for legend, tooltip, and zooming toolkit in chart.
    • Label rotation based on text-anchor - Chart provides support for rotating axis label with the text-anchor as start.
  • Diagram
    • Automatic LineRouting - Support has been added to automatically reroute the line around the nodes obstructing the line.
  • Calculate
    • Excel-like array formula calculation - Calculate supports array formula calculation like Excel. An array formula is a formula that performs multiple calculations on one or more items in an array. Sample formula: {=A1:A5*B1:B5}
    • Excel-like table-structured references - Calculate supports table-structured formulas for formula calculation like Excel. A range of cells in a spreadsheet table can be referenced as a table reference.
    • New COUNTIFS formula - Calculate supports new COUNTIFS Excel formula. The CountIfs formula returns a number of cells that satisfy a set of given criteria.
  • Maps
    • Toggle Legend - Provided support to toggle visibility of shapes/bubbles on legend item click.
  • Pivot Chart
    • Multiple Axes - You can split the pivot chart and its area into multiple panes to draw multiple series with multiple axes.
  • Pivot Client
    • Calculated Members - Users can now frame a dynamic dimension or measure using the existing ones along with a simple calculation at runtime.
  • Tree Map
    • Change initial rendering level - Provided support to render the tree map from any level instead of the first level.

Essential JS 2

  • New components
    • Avatar - Avatars are icons or figures that represent a particular person. They are developed as pure CSS components and support popular media formats like images, SVG, font-icons, and letters.
    • Badge - The badge is a notification component developed in pure CSS that can be used to alert users about new or unread messages, notifications, and additional information about content.
    • Button group - The button group is a pure CSS component that groups a series of buttons together vertically or horizontally. It supports single and multiple selection behaviors.
    • Color picker - The color picker lets users pick a color either by selecting color values or by adjusting them.
    • Diagram - The Essential JS 2 diagram component is used to build visual representations of information.
    • Document editor - The document editor component is used to create, edit, view, and print Word documents in web applications.
    • Heat map - The heat map control is used to visualize two-dimensional data in which the values are represented in a color gradient or as fixed colors.
    • Pivot grid - The pivot grid is a multidimensional data visualization component built on top of relational data sources.
    • Range navigator - The range navigator provides an intuitive interface for selecting a smaller range from a larger collection.
    • Rich text editor - The rich text editor component is a WYSIWYG editor that provides the best user experience for creating and updating rich text content.
    • Smith chart - A Smith chart is a data visualization tool used for high frequency circuit applications. It contains two sets of circles to plot the parameters of transmission lines.
    • Sparkline - A sparkline is a very small chart, typically drawn without axes or coordinates, that conveys information to the user in a small space.
    • Switch - The switch component lets users toggle between checked and unchecked states.
    • Toast - A toast is a small container in which users can show single or multiple informative lines with actions.
    • Tree map - The tree map is used to visualize hierarchical data in the form of nested rectangles. The area of each item is calculated based on its corresponding numeric value.
    • Theme studio - Theme studio is a new web-based tool that can be used to customize the Essential JS 2 component themes. It supports importing and exporting customized themes, and filtering to select which components to change.
  • Chart
    • Scrollbar - Scrollbar support has been provided to zoom and pan the chart.
    • Histogram - Chart provides options for histogram series type
    • Pie grouping - Now, pie slice in the accumulation chart can be grouped based on data count.
  • Grid
    • Multidelete - Now multiple records can be deleted from grid at a time. Enable multiselection to select multiple records and use the toolbar delete button or the Delete key to remove multiple records.
  • List View
    • UI virtualization - List items by loading only visible list items in a view port. This helps improve list view performance when loading a large number of items. The list items are updated dynamically while users scroll the list.
  • Maps
    • Animation on zooming - Provided smooth transition support for zooming of layers.
    • Title trim - Provided support to trim the map title when it exceeds the available width.
    • Print and Export - Provided support for printing and exporting maps.
  • Schedule
    • Multiple resources - Multiple resources and grouping support has been added to view and manage events of multiple users on the same page.
    • Timescale - An enhanced option provided to allow users to change or hide the time interval duration on schedule as per their application requirement.
  • Slider
    • Slider limits - Set min and max values to limit which values can be selected within the range.
    • Drag interval - Enables users to interact with a range slider by dragging the range bar.
  • Uploader
    • Chunk upload - This feature breaks a large file into small chunks, and uploads them to the server in a sequential order using asynchronous mode. The chunk upload comes with pause, resume, retry, and cancel options.
New diagram control

Syncfusion Essential Studio JavaScript

Una raccolta completa dell'interfaccia utente per JavaScript.

Hai una domanda?

Chatta live con i nostri specialisti di gestione delle licenze di Syncfusion ora.